NWS forecast for any "City, St" or Zipcode


Weather & Forecasts
Current Conditions
Forecasts
Satellite Imagery
Radar Imagery
Winter Wx
Fire Weather
Long Range Outlooks
Other


Kentucky Climate
Climatology
Pests/Disease
Ag/Wx Calculators
Hydrology Info.


Other UKAWC Sites
Severe Wx
Tropical Wx
Kentucky Ag Wx
Drought
National Wx
International Wx
Learning About Wx
About UKAWC


UKAWC Home


[Header Map]


Kentucky Monthly Climate Summaries


KY Monthly Rainfall Departures


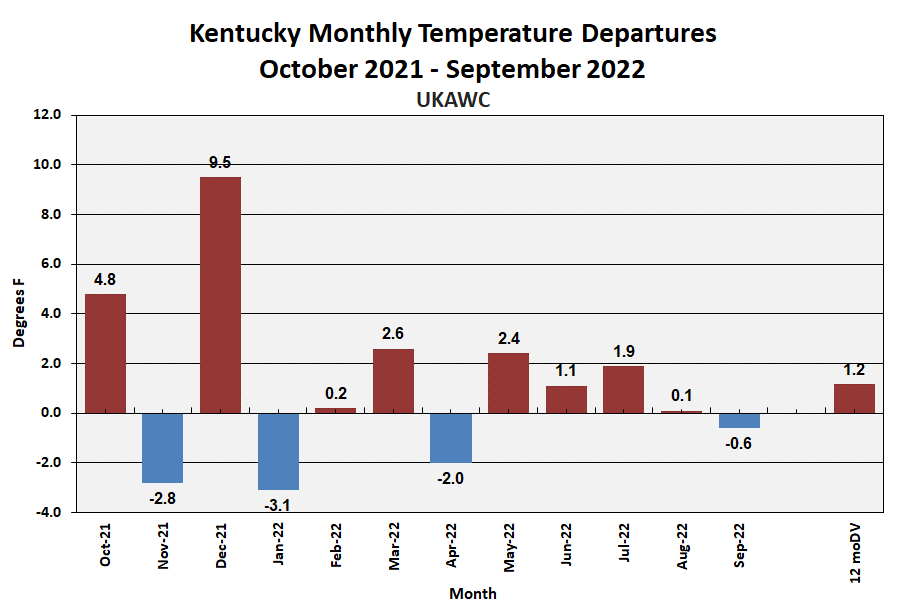
KY Monthly Temperature Departures

Past Years
Past Weekly Summaries
Current Kentucky Crop and Weather Report


 KENTUCKY MONTHLY AND ANNUAL CLIMATE SUMMARY FOR -- 2017
By: Tom Priddy and Matt Dixon -- UK Agricultural Weather Center

* Based on Preliminary Data. Weekly graphs available within the UKAWC Kentucky 
Weather Information Web site. Sources: UKAWC, NCDC and Midwest Regional Climate 
Center
===
Kentucky Climate Summary
For the Period December 2017

Below Normal Temperatures and Below Normal Precipitation: *

Entering the month of December, precipitation was running much below normal. The 
state had gone two straight weeks with little to no rainfall. That trend continued 
into the first half of December as the state only saw one significant round of 
widespread showers. That occurred over the course of the 4th and 5th, bringing 
rainfall totals around a half to three quarters of an inch. Even that week, rainfall 
was below normal. The US Drought Monitor took notice with 55% of the state 
experiencing abnormally dry conditions (Southern Kentucky) as of the December 19th 
update. Saying that, the high percentage was short lived as the tide turned as low 
pressure lifted northeast through the region on the 22nd and 23rd. This system had a 
large amount of moisture to work with and led to most of Kentucky averaging over 
1.5 inches. A large portion of Western and South Central Kentucky were even over 2.5 
inches. After that system, the percentage of Kentucky experiencing Abnormally Dry 
conditions on the December 26th update was under 3%.

Temperature-wise, the first month of the winter season was definitely a drastic 
difference from the abnormally warm one Kentucky experienced last year. Overall, 
temperatures ran a couple degrees below normal, but the bigger story was the return 
of Arctic air, especially the last week of 2017. Temperatures dipped into the single 
digits over a handful of the nights, along with the wind chill dipping below zero at 
times. This led to an extended period of livestock cold stress in the Emergency 
category. The cold air did result in many seeing some wintry weather, but any snow 
accumulations were on the light side.

Temperatures for the period averaged 36 degrees across the state which was 2 degrees 
cooler than normal. High temperatures averaged from 45 in the West to 45 in the 
East. Departure from normal high temperatures ranged from 3 degrees cooler than 
normal in the West to 3 degrees cooler than normal in the East. Low temperatures 
averaged from 29 degrees in the West to 29 degrees in the East. Departure from 
normal low temperature ranged from 1 degree cooler than normal in the West to 1 
degree warmer than normal in the East. The extreme high temperature for the period 
was 71 at BURKESVILLE 3W and the extreme low was 2 at ALEXANDRIA 5NW.

Precipitation (liq. equ.) for the period totaled 2.85 inches statewide which was 1.6 
inches below normal and 64% of normal. Precipitation totals by climate division, West 
3.03 inches, Central 3.30 inches, Bluegrass 2.33 inches and East 2.76 inches, which 
was 1.85, 1.52, 1.54 and 1.47 inches below normal. By station, precipitation totals 
ranged from a low of 0.19 inches at MONTICELLO AWOS to a high of 4.26 inches at 
BOWLING GREEN 5S.

* = Based on preliminary data

Summarized and averaged data for the period 20171201 to 20171231(Last 31 Days)
(Not for Legal purposes. Departure from Norms based on climate divisional Averages)

                            AIR TEMPERATURE          PRECIPITATION    ExtremeTemp
STATION              MAX  DEV  MIN  DEV  AVR  DEV  TOTAL   DEV  %NORM  HI   LO
--------------------------------------------------------------------------------
WEST(CD1)             45   -3   29   -1   37   -2   3.03  -1.85   62   70    6
CENTRAL(CD2)          45   -2   28   -1   37   -1   3.30  -1.52   68   71    7
BLUEGRASS(CD3)        42   -4   26   -2   34   -3   2.33  -1.54   60   69    2
EAST(CD4)             45   -3   29    1   37   -1   2.76  -1.47   65   71    3
--------------------------------------------------------------------------------
STATE                 44   -3   28   -1   36   -2   2.85  -1.60   64   71    2


===
Kentucky Climate Summary
For the Period November 2017

Near Normal Temperatures and Below Precipitation:

November started with a very active first half of the month as multiple frontal 
boundaries pushed north and south across the region. This led to multiple rounds of 
showers and at times, storms. While accumulations were not very high, the frequency 
of the events in addition to cloud cover kept soil conditions on the moist side and 
farmers out of the fields, slowing harvest progress. It was not until the last couple 
of weeks that Kentuckians finally saw a break. Most of this time was rain-free. In 
fact, between the 20th and 26th, only three stations in the UK Ag Weather Center’s 
95-station database recorded rainfall and the maximum was three hundredths. Overall, 
the state only averaged 2.26 inches for the month, which was over 1.5 inches below normal.

Temperatures for the period averaged 48 degrees across the state which was near 
normal. High temperatures averaged from 59 in the West to 58 in the East. Departure 
from normal high temperatures ranged from near normal in the West to 1 degree cooler 
than normal in the East. Low temperatures averaged from 40 degrees in the West to 38 
degrees in the East. Departure from normal low temperature ranged from 2 degrees 
warmer than normal in the West to 4 degrees warmer than normal in the East. The 
extreme high temperature for the period was 81 at BOWLING GREEN APT and the extreme 
low was 17 at VANCEBURG 6W.

Precipitation (liq. equ.) for the period totaled 2.23 inches statewide which was 1.67 
inches below normal and 57% of normal. Precipitation totals by climate division, West 
2.34 inches, Central 2.07 inches, Bluegrass 2.96 inches and East 1.53 inches, which 
was 2.18, 2.04, 0.45 and 2.05 inches below normal. By station, precipitation totals 
ranged from a low of 0.78 inches at WILLIAMSBURG AWOS to a high of 4.78 
inches at LA GRANGE 6NW. 

Summarized and averaged data for the period 20171101 to 20171130(Last 30 Days)
(Not for Legal purposes. Departure from Norms based on climate divisional Averages)

                            AIR TEMPERATURE          PRECIPITATION    ExtremeTemp
STATION              MAX  DEV  MIN  DEV  AVR  DEV  TOTAL   DEV  %NORM  HI   LO
--------------------------------------------------------------------------------
WEST(CD1)             59    0   40    2   49    0   2.34  -2.18   52   81   20
CENTRAL(CD2)          58    0   39    2   48    0   2.07  -2.04   50   81   18
BLUEGRASS(CD3)        55   -2   38    1   47    0   2.96  -0.45   87   79   18
EAST(CD4)             58   -1   38    4   48    1   1.53  -2.05   43   80   17
--------------------------------------------------------------------------------
STATE                 58   -0   39    2   48    0   2.23  -1.67   57   81   17


===
Kentucky Climate Summary
For the Period October 2017

Above Normal Temperatures and Rainfall:

Heading into October, most of the state had gone two weeks without seeing any 
rainfall. The US Drought Monitor took notice and introduced ‘Abnormally Dry 
Conditions’ to portions of Western Kentucky. Luckily, the state started October with 
yet another remnant tropical system moving through the area. This time, it was 
Nate. The remnant hurricane interacted with a cold front on the 7th and 8th and 
produced a tremendous amount of rainfall. After it was all said and done, the state 
averaged over two inches. The active pattern then continued for a second straight 
week and after a temporary dry spell, the state averaged another two inches the last 
week of October. Overall, it was the 9th wettest October on record with a state 
average of 5.10 inches in what is normally the driest month of the year for Kentucky. 
It also became the 8th straight month that Kentucky precipitation had averaged above 
normal.

Temperatures remained warm for most of the month, but it was only a matter of time 
before that first frost/freeze. That came over the last few days of October as lows 
dipped into the low to middle 30s, some in the 20s. 

Temperatures for the period averaged 60 degrees across the state which was 2 degrees 
warmer than normal. High temperatures averaged from 71 in the West to 71 in the 
East. Departure from normal high temperatures ranged from 1 degree cooler than 
normal in the West to 1 degree warmer than normal in the East. Low temperatures 
averaged from 50 degrees in the West to 48 degrees in the East. Departure from 
normal low temperature ranged from 3 degrees warmer than normal in the West to 5 
degrees warmer than normal in the East. The extreme high temperature for the period 
was 90 at CAPE GIRARDEAU ASOS and the extreme low was 24 at LIBERTY 3SW.

Precipitation (liq. equ.) for the period totaled 5.17 inches statewide which was 1.87 
inches above normal and 157% of normal. Precipitation totals by climate division, 
West 5.38 inches, Central 5.36 inches, Bluegrass 5.00 inches and East 4.93 inches, 
which was 1.87, 1.96, 1.91 and 1.72 inches above normal. By station, precipitation 
totals ranged from a low of 1.43 inches at POPLAR BLUFF ASOS to a high of 12.14 
inches at GREENVILLE 6N. 

Summarized and averaged data for the period 20171001 to 20171031(Last 31 Days)
(Not for Legal purposes. Departure from Norms based on climate divisional Averages)

                            AIR TEMPERATURE          PRECIPITATION    ExtremeTemp
STATION              MAX  DEV  MIN  DEV  AVR  DEV  TOTAL   DEV  %NORM  HI   LO
--------------------------------------------------------------------------------
WEST(CD1)             71   -1   50    3   61    2   5.38   1.87  153   90   26
CENTRAL(CD2)          71    1   49    3   60    2   5.36   1.96  158   86   24
BLUEGRASS(CD3)        69    0   48    2   59    2   5.00   1.91  162   86   27
EAST(CD4)             71    1   48    5   60    3   4.93   1.72  154   88   24
--------------------------------------------------------------------------------
STATE                 70   -0   49    4   60    2   5.17   1.87  157  100   24


===
Kentucky Climate Summary
For the Period September 2017

Below Normal Temperatures and Above Normal Rainfall:

Kentucky saw two tropical systems pass through the area over the first half of 
September. The remnants of Hurricane Harvey arrived over the first couple days of 
the month, brining widespread moderate to locally heavy showers. Rainfall was most 
prevalent across Central Kentucky where several locations recorded over five inches. 
The high amount of rainfall in a short period of time led to numerous flood warnings. 
The remnants of Hurricane Irma then followed on the 12th and 13th, bringing on and 
off light showers. Unlike the extremely high rainfall totals seen with Harvey, the 
state only averaged three quarters of an inch with Irma. The rain and cloud cover 
associated with both systems led to a cool first half of the month. In fact, after 
the second week of September, the Bluegrass State had gone four straight weeks of 
temperatures averaging below normal.  

The rest of the month turned mostly dry. In fact, most of the state did not receive 
any rainfall over the last week of September. Still, Harvey brought more than enough 
rainfall to push Kentucky to a seventh straight month of above normal rainfall. Along 
with the dryness, heat returned over the latter half of September. Even though the 
22nd signaled the official start of fall, the third week of September had highs 
routinely rise into the middle 80s to low 90s.  

Temperatures for the period averaged 68 degrees across the state which was 1 degree
cooler than normal. High temperatures averaged from 82 in the West to 77 in the 
East. Departure from normal high temperatures ranged from near normal in 
the West to 3 degrees cooler than normal in the East. Low temperatures averaged 
from 59 degrees in the West to 57 degrees in the East. Departure from normal low 
temperature ranged from near normal in the West to 1 degree warmer than 
normal in the East. The extreme high temperature for the period was 95 at 
CAPE GIRARDEAU ASOS and the extreme low was 42 at the same station.

Precipitation (liq. equ.) for the period totaled 4.26 inches statewide which was 0.74 
inches above normal and 121% of normal. Precipitation totals by climate division, 
West 3.99 inches, Central 6.74 inches, Bluegrass 3.87 inches and East 2.42 inches, 
which was 0.50, 2.87, 0.65 and -1.06 inches respectively from normal. By station, 
precipitation totals ranged from a low of 0.06 inches at POPLAR BLUFF ASOS to a high 
of 10.30 inches at GLASGOW 11W. 

Summarized and averaged data for the period 20170901 to 20170930(Last 30 Days)
(Not for Legal purposes. Departure from Norms based on climate divisional Averages)

                            AIR TEMPERATURE          PRECIPITATION    ExtremeTemp
STATION              MAX  DEV  MIN  DEV  AVR  DEV  TOTAL   DEV  %NORM  HI   LO
--------------------------------------------------------------------------------
WEST(CD1)             82    0   59    0   71    0   3.99   0.50  114   95   42
CENTRAL(CD2)          79   -2   58    0   68   -1   6.74   2.87  174   93   43
BLUEGRASS(CD3)        77   -3   57    0   67   -1   3.87   0.65  120   91   42
EAST(CD4)             77   -3   57    1   67   -1   2.42  -1.06   70  104   44
--------------------------------------------------------------------------------
STATE                 79   -2   58    0   68   -1   4.26   0.74  121  104   42


===
Kentucky Climate Summary
For the Period August 2017

Below Normal Temperature and Above Normal Rainfall:

While rainfall was above normal for the Bluegrass state for the month of August 2017, 
drier than normal conditions in the western and some central sections of the state 
had some crops, especially corn looking less than optimum. In the eastern part of the 
state, rainfall was much above normal. By the end of the month, the remnants of 
Hurricane Harvey had started to dump tremendous amounts of rainfall on much of the 
state, especially west and central. (Much of that rainfall will be reported on the first 
day of next months report.)

From the NWS:

August will be the first month since May 2016 that the average temperature was more 
than a degree below normal for the month at Louisville/Lexington. Each month since 
then either has been within a degree of normal or above it. Bowling Green's streak 
goes a little further back, to January 2016.

Temperatures for the period averaged 73 degrees across the state which was 2 degrees 
cooler than normal. High temperatures averaged from 84 in the West to 82 in the East. 
Departure from normal high temperatures ranged from 4 degrees cooler than normal in 
the West to 4 degrees cooler than normal in the East. Low temperatures averaged from 
65 degrees in the West to 63 degrees in the East. Departure from normal low 
temperature ranged from 1 degrees cooler than normal in the West to 1 degrees warmer 
than normal  in the East. The extreme high temperature for the period was 96 at 
LOUISVILLE APT and the extreme low was 48
at BURKESVILLE 3W.

Precipitation (liq. equ.) for the period totaled 4.28 inches statewide which was 0.49 
inches above normal and 113% of normal. Precipitation totals by climate division, 
West 3.21 inches, Central 3.97 inches, Bluegrass 3.88 inches and East 6.06 inches, 
which was -0.31, 0.20, 0.11 and 1.96 inches respectively from normal. By station, 
precipitation totals ranged from a low of 1.01 inches at
CALHOUN 5NW to a high of 9.42 inches at SOMERSET.

Summarized and averaged data for the period 20170801 to 20170831(Last 31 Days)
(Not for Legal purposes. Departure from Norms based on climate divisional Averages)

                             AIR TEMPERATURE PRECIPITATION    ExtremeTemp
STATION              MAX  DEV  MIN  DEV  AVR  DEV  TOTAL   DEV %NORM   HI   LO
--------------------------------------------------------------------------------
WEST(CD1)             84   -4   65   -1   75   -2   3.21  -0.31   91   95   50
CENTRAL(CD2)          83   -4   64   -1   74   -2   3.97   0.20  105   96   48
BLUEGRASS(CD3)        82   -3   63   -1   72   -3   3.88   0.11  103   92   49
EAST(CD4)             82   -4   63    1   72   -2   6.06   1.96  148   92   50
--------------------------------------------------------------------------------
STATE                 83   -4   64   -0   73   -2   4.28   0.49  113   96   48


===
Kentucky Climate Summary
For the Period July 2017

Overall, Kentucky saw near normal rainfall and temperatures for the month of July, 
but that only tells half of the story.  After an extremely wet first week of the 
month, when the state averaged nearly two inches, conditions became fairly dry across 
the state until the end of July.  Showers and storms were isolated to scattered in 
nature for much of the area, keeping most dry.  In fact, the second week of the month 
was one of the driest weeks of the growing season thus far. Any locations that were 
lucky enough to get some rainfall did see torrential rains as the state was situated 
within a very moist air mass.  

It felt it as though it was very warm throughout the month. We did have temperatures 
peak in the mid to upper 90s for a couple days in the middle of July, but most of the 
time, the state sat in the upper 80s to low 90s.  This is actually right around 
normal.  What made the difference was how humid it was outdoors.  Dew points 
increased into the 70s, pushing heat indices into the triple digits at times, leading 
to oppressive heat.  In addition to not much recovery at night, livestock stress 
lifted into the danger to emergency category.  Luckily, the passage of a strong cold 
front at the end of the month brought a return of much welcomed below normal 
temperatures and noticeably less humid conditions.

Above Normal Temperatures and Rainfall: 

                 Temp    Norm     Dep          Prcp    Norm     Dep   %Norm
------------------------------------------------------------------------------- 
WEST KY01        79.7    78.3     1.4          3.00    4.09   -1.09      73
CENTRAL KY02     77.3    76.6     0.7          4.20    4.45   -0.25      94
BLUEGRASS KY03   75.9    75.5     0.4          5.18    4.45    0.73     116
EAST KY04        75.0    74.8     0.2          5.59    4.67    0.92     120
-------------------------------------------------------------------------------
Statewide KY     76.9    76.2     0.7          4.56    4.43    0.13     103


===
Kentucky Climate Summary
For the Period June 2017

Below Normal Temperatures and Above Normal Rainfall: 

Temperatures for the period averaged 72 degrees across the state which was near 
normal. High temperatures averaged from 84 in the West to 81 in the East. Departure 
from normal high temperatures ranged from 2 degrees cooler than normal in the West to 
2 degrees cooler than normal in the East. Low temperatures averaged from 64 degrees 
in the West to 60 degrees in the East. Departure from normal low temperature ranged 
from 1 degree warmer than normal in the West to 1 degree warmer than normal in the 
East. The extreme high temperature for the period was 94 at CAPE GIRARDEAU ASOS and 
the extreme low was 46 at PAINTSVILLE 4W.

Precipitation (liq. equ.) for the period totaled 4.90 inches statewide which was 0.48 
inches above normal and 111% of normal. Precipitation totals by climate division, 
West 4.73 inches, Central 5.10 inches, Bluegrass 5.12 inches and East 4.65 inches, 
which was 0.42, 0.67, 0.69 and 0.15 inches above normal. By station, precipitation 
totals ranged from a low of 1.02 inches at HENDERSON 5E to a high of 8.12 inches 
at GREENVILLE 6N.

                 Temp    Norm     Dep          Prcp    Norm     Dep   %Norm
-------------------------------------------------------------------------------
WEST KY01        74.5    74.7    -0.2          4.87    4.06    0.81     120
CENTRAL KY02     72.3    73.1    -0.8          4.77    4.21    0.56     113
BLUEGRASS KY03   70.9    71.8    -0.9          5.04    4.30    0.74     117
EAST KY04        69.8    71.2    -1.4          4.20    4.40   -0.20      96
-------------------------------------------------------------------------------
Statewide KY     71.7    72.6    -0.9          4.67    4.25    0.42     110


===
Kentucky Climate Summary
For the Period May 2017

Above Normal Temperatures and Rainfall: 

May 2017 marked the third straight month that Kentucky has seen above normal 
precipitation. Statewide rainfall averaged over an inch for each week throughout the 
month. In fact, going back into April, the state had gone six straight weeks 
averaging over an inch. Overall, it was a very active May, highlighted by the first 
week of the month. A slow moving low-pressure system led to a statewide average of 
1.70 inches. Following the disturbance, temperatures plummeted that weekend. On the 
mornings of the 7th and 8th, much of Central/Eastern Kentucky and the Bluegrass saw 
low temperatures dip into the 30s. Lows are normally in the low to middle 50s for 
this time of year. The cooler temperatures were short-lived and by the third week of 
May, it felt more like summer with the return of heat and humidity.  This led to yet 
another month of above normal temperatures. Looking back at the past year, 
temperatures in Kentucky averaged above normal each and every month.


                 Temp    Norm     Dep          Prcp    Norm     Dep   %Norm
-------------------------------------------------------------------------------
WEST KY01        67.1    66.4     0.7          5.12    5.44   -0.32      94
CENTRAL KY02     65.7    64.8     0.9          6.18    5.55    0.63     111
BLUEGRASS KY03   63.8    63.4     0.4          6.18    5.24    0.94     118
EAST KY04        63.7    63.1     0.6          6.34    5.02    1.32     126
-------------------------------------------------------------------------------
Statewide KY     65.0    64.3     0.7          5.97    5.29    0.68     113


===
Kentucky Climate Summary
For the Period April 2017

Well Above Normal Temperatures and Above Normal Precipitation: 

An active pattern slowed planting progress through the month of April. This was 
especially true over the latter half of the month. In Kentucky, the wettest week of 
2017 occurred between the 17th and 23rd as the state averaged 2.10 inches, which was 
over an inch above normal. At least some portion of the state received rainfall each 
day as multiple frontal boundaries and disturbances passed through the area. This led 
to some minor river flooding across Eastern Kentucky. The wet trend continued into 
the last week of April as portions of Kentucky along the Ohio River, running from 
Western Kentucky and into the Bluegrass, saw another round of significant rainfall. 
Western Kentucky averaged 2 inches for a second straight week with the two 
westernmost tiers of counties seeing 3 to 4+ inches. Overall, the state only saw 
slightly above normal rainfall for the month. Other than a dry February, Kentucky 
has seen above normal rainfall four of the past five months.

Temperatures remained warm through much of April. Each week saw highs peak in the 
80s at some point. Even saw a handful of locations hit the 90s over the last week of 
the month. Overall, it was the second warmest April on record for the Bluegrass 
State. The state has now went 11 straight months with temperatures averaging above 
normal.

                 Temp    Norm     Dep          Prcp    Norm     Dep   %Norm
------------------------------------------------------------------------------                   
WEST KY01        62.6    57.5     5.1          4.70    4.53    0.17     104
CENTRAL KY02     62.2    56.2     6.0          4.29    4.22    0.07     102
BLUEGRASS KY03   60.9    54.6     6.3          3.65    3.84   -0.19      95
EAST KY04        60.8    55.0     5.8          5.04    3.86    1.18     131
------------------------------------------------------------------------------
Statewide KY     61.6    55.8     5.8          4.49    4.10    0.39     109


===
Kentucky Climate Summary
For the Period March 2017

Above Normal Temperatures and Precipitation: 

March finished near normal for both precipitation and temperatures in Kentucky. The 
month roared in like a lion with strong to severe storms pushing across the area 
ahead of a cold front. Damaging winds, hail, and even tornadoes was seen on the 
morning of the first. The National Weather Service in Louisville mentioned it was 
the largest tornado outbreak across the area in 5 years. After a dry February, much 
of the area received over an inch of rainfall with this system. More severe weather 
followed towards the end of the month.  

Between the events was a period of winter-like temperatures. Leading into the cold 
snap, the Bluegrass State had experienced nine straight weeks of above normal 
temperatures. This led to winter wheat, plasticulture strawberries, peaches, and 
other fruit trees all in advanced growth stages for this time of the year. Because 
of this, Freeze Warnings were issued a little earlier than normal as lows dipped well 
below freezing multiple times. The most extreme cold came on the mornings of the 
15th and 16th as lows dipped into the middle teens to low 20s. John Strang, UK 
Extension Horticulturist, goes into more detail on the extent of damage to peach buds 
and flowers in the latest edition of Kentucky Fruit Facts. Winter wheat impacts, 
injury identification, and considerations moving forward can be found in the Grain 
Crops Update. The image below shows low temperatures across the state over those two 
nights.  


Summarized and averaged data for the period 20170301 to 20170331
(Not for Legal purposes. Departure from Norms based on climate divisional Averages)

                  Temp    Norm     Dep          Prcp    Norm     Dep   %Norm
----------------------------------------------------------------------------                  
WEST KY01         50.2    47.9     2.3          4.74    4.32    0.42     110
CENTRAL KY02      48.9    46.7     2.2          4.23    4.40   -0.17      96
BLUEGRASS KY03    46.2    44.6     1.6          4.98    4.14    0.84     120
EAST KY04         46.5    45.7     0.8          4.56    4.07    0.49     112
----------------------------------------------------------------------------
Statewide KY      47.9    46.2     1.7          4.62    4.22    0.40     109


===
Kentucky Climate Summary
For the Period February 2017

Well Above Normal Temperatures and Below Normal Rainfall: *

Winter? It felt more like spring throughout much of February. Well above normal 
temperatures led Kentucky to the warmest February on a 123-year record. The state 
averaged 46.1 degrees, which was over 8 degrees above normal for the month. The 
unseasonably warm conditions was carried by numerous days in the 60s, but even the 
70s were seen occasionally. Several locations pushed into the lower 80s on the 24th. 
According to the National Weather Service in Louisville, this was the first time the 
city has ever broken 80 in February. Extreme cold was nearly nonexistent.  Through 
the end of the month, the state had gone 8 straight weeks of above normal 
temperatures. While it was warm, February saw well below normal rainfall. The state 
only averaged 2 inches for the month. 

Temperatures for the period averaged 48 degrees across the state which was 10 degrees 
warmer than normal and 8 degrees warmer than the previous period. High temperatures 
averaged from 58 in the West to 58 in the East. Departure from normal high 
temperatures ranged from 8 degrees warmer than normal in the West to 9 degrees 
warmer than normal in the East. Low temperatures averaged from 39 degrees in the 
West to 37 degrees in the East. Departure from normal low temperature ranged from 10 
degrees warmer than normal in the West to 11 degrees warmer than normal in the 
East. The extreme high temperature for the period was 82 degrees at HARTFORD 3E and 
the extreme low was 7 degrees at CYNTHIANA 8N.

Precipitation (liq. equ.) for the period totaled 2.97 inches statewide which was 0.97 
inches below normal and 75% of normal. Precipitation totals by climate division, West 
2.50 inches, Central 3.04 inches, Bluegrass 3.64 inches and East 2.70 inches, which 
was -1.88, -1.22, 0.23 and -1.01 inches respectively from normal. By station, 
precipitation totals ranged from a low of 1.28 inches at CAPE GIRARDEAU ASOS to a 
high of 5.21 inches at ALEXANDRIA 5NW. 

* = Based on preliminary data

Summarized and averaged data for the period 20170201 to 20170302(Last 30 Days)
(Not for Legal purposes. Departure from Norms based on climate divisional Averages)

                            AIR TEMPERATURE          PRECIPITATION    ExtremeTemp
STATION              MAX  DEV  MIN  DEV  AVR  DEV  TOTAL   DEV  %NORM  HI   LO
--------------------------------------------------------------------------------
WEST(CD1)             58    8   39   10   49   10   2.50  -1.88   57   82   10
CENTRAL(CD2)          58    9   39   11   48   10   3.04  -1.22   71   81    8
BLUEGRASS(CD3)        56    9   37   11   46    9   3.64   0.23  107   80    7
EAST(CD4)             58    9   37   11   48   10   2.70  -1.01   73   81    7
--------------------------------------------------------------------------------
STATE                 58    9   38   11   48   10   2.97  -0.97   75   82    7


===
Kentucky Climate Summary
For the Period January 2017

Well Above Normal Temperatures and Near Normal Rainfall: *

The new year started with a blast of Arctic air from the north. Following a winter 
storm with snow accumulations of 1 to 3 inches across the state (locally 4+), 
temperatures dropped into the single digits and even below zero over the first 
weekend of the month. This pushed livestock cold stress into the emergency category 
for an extended period. With that said, it was the last time we saw 
"winter" for the rest of the month. Temperatures went on the uphill climb, 
rising well above normal. Each week saw temperatures climb into the 60s and 70s at 
some point. Between the 16th and 22nd, average temperatures were 19 degrees above 
normal. Normal high temperatures for that time of year are in the low to middle 40s. 
Official data shows that January 2017 was the 10th warmest on record with data going 
back 123 years. Accompanying the warm temperatures was an active pattern that set up 
across the state, resulting in many rounds of showers through the end January. This 
carried over from an active December, following 'Extreme' drought 
conditions in November. January marked the first time since early September with no 
drought or abnormally dry conditions.

Temperatures for the period averaged 42 degrees across the state which was 9 degrees 
warmer than normal. High temperatures averaged from 49 in the West to 49 in the 
East. Departure from normal high temperatures ranged from 6 degrees warmer than 
normal in the West to 5 degrees warmer than normal in the East. Low temperatures 
averaged from 36 degrees in the West to 36 degrees in the East. Departure from 
normal low temperature ranged from 11 degrees warmer than normal in the West to 13 
degrees warmer than normal in the East. The extreme high temperature for the period 
was 73 at POPLAR BLUFF ASOS and the extreme low was -3 at CAMPBELLSVILLE 7W.

Precipitation (liq. equ.) for the period totaled 4.05 inches statewide which was 0.32 
inches above normal and 109% of normal. Precipitation totals by climate division, 
West 3.42 inches, Central 4.42 inches, Bluegrass 4.09 inches and East 4.28 inches, 
which was -0.51, 0.43, 0.87 and 0.49 inches respectively from normal. By station, 
precipitation totals ranged from a low of 1.44 inches at CARBONDALE ASOS to a high of 
8.28 inches at VANCEBURG 6W. 

* = Based on preliminary data

Summarized and averaged data for the period 20170101 to 20170131(Last 31 Days)
(Not for Legal purposes. Departure from Norms based on climate divisional Averages)

                            AIR TEMPERATURE          PRECIPITATION    ExtremeTemp
STATION              MAX  DEV  MIN  DEV  AVR  DEV  TOTAL   DEV  %NORM  HI   LO
--------------------------------------------------------------------------------
WEST(CD1)             49    6   36   11   42    8   3.42  -0.51   87   73   -2
CENTRAL(CD2)          49    7   36   11   43   10   4.42   0.43  111   72   -3
BLUEGRASS(CD3)        46    5   34   11   40    8   4.09   0.87  127   70   -2
EAST(CD4)             49    5   36   13   43   10   4.28   0.49  113   70   -1
--------------------------------------------------------------------------------
STATE                 48    6   36   12   42    9   4.05   0.32  109   73   -3


===
Ag Weather Center, Department of Biosystems & Agricultural Engineering, University of Kentucky