KENTUCKY MONTHLY AND ANNUAL CLIMATE SUMMARY FOR -- 2014
By: Tom Priddy and Matt Dixon -- UK Agricultural Weather Center
* Based on Preliminary Data. Weekly graphs available within the UKAWC Kentucky
Weather Information Web site. Sources: UKAWC, NCDC and Midwest Regional Climate
Center
===
Kentucky Climate Summary
For the Period: December 2014
Above Normal Temperatures and Below Normal Precipitation: *
After a very cold November, the tide turned over the last month of the year with
unseasonably mild temperatures in place. Below normal temperatures were rare to see,
not really showing a distinct wintry air mass until the last few days of the month.
The warmest period occurred between the 22nd and 28th. Southerly flow brought a warm
and moist air mass to the region that lasted for much of the week. Highs typically
rose into the 50s to 60s each day. The mild temperatures led to the highest above
normal deviation seen all year for the Bluegrass State, 10 degrees above average.
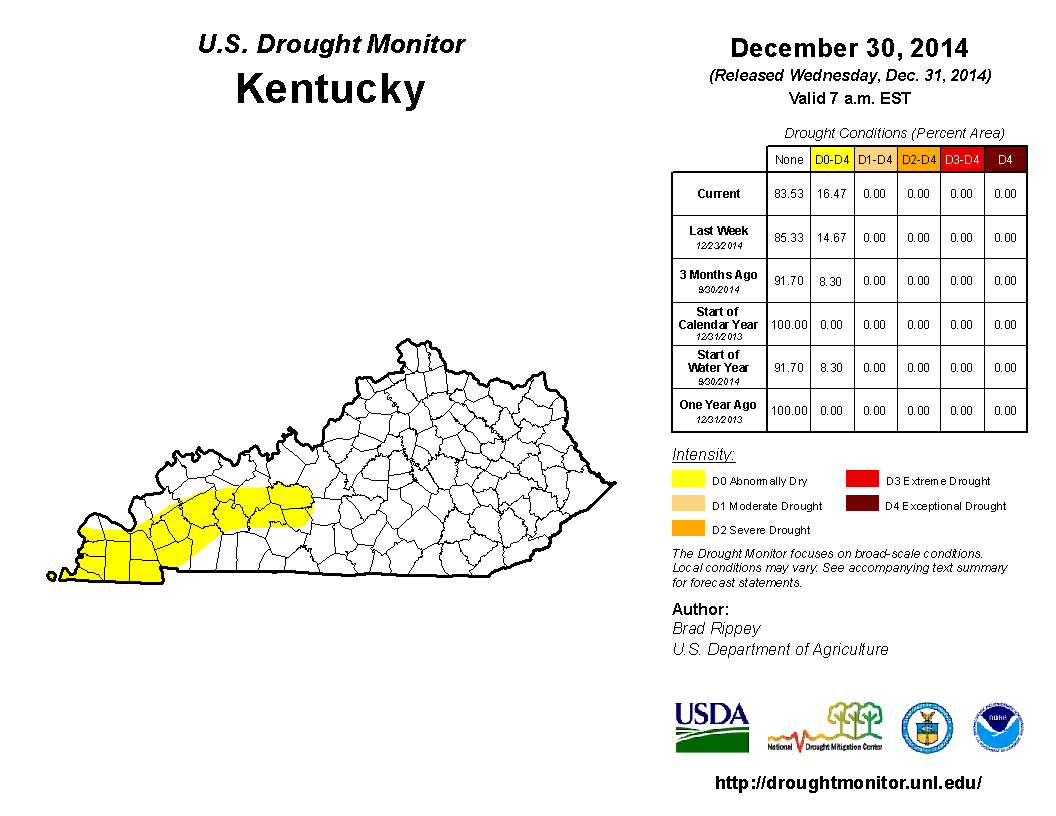
Dry conditions also remained in place across the Commonwealth with the US Drought
Monitor reintroducing abnormally dry conditions to portions of Western and Central
Kentucky (Image Below). The state only averaged a little over three inches, which was
over an inch below normal. This marked the second straight month of much below normal
precipitation. The only major exception to the dry pattern was over the first week of
the month. Most locations saw one to two inches of rainfall. When showers were not
present, a persistent light drizzle kept conditions dreary.
 The driest period occurred over the second week of December. The majority of the
state saw at most, a couple hundredths of rainfall. Precipitation was over an inch
below normal, which was the most significant weekly departure seen all year. Looking
at precipitation type, it was quite the difference from December 2013. Kentucky saw
little in the way of wintry weather with mild temperatures in place. Lexington,
Louisville, Bowling Green, and Jackson each received just a trace of snow.
Temperatures for the period averaged 40 degrees across the state which was 2 degrees
warmer than normal. High temperatures averaged from 46 in the West to 47 in the
East. Departure from normal high temperatures ranged from 2 degrees cooler than
normal in the West to 1 degree cooler than normal in the East. Low temperatures
averaged from 35 degrees in the West to 34 degrees in the East. Departure from normal
low temperature ranged from 5 degrees warmer than normal in the West to 6 degrees
warmer than normal in the East. The extreme high temperature for the period was 69
at JACKSON 3SE and the extreme low was 13 at BURLINGTON 4S.
Precipitation (liq. equ.) for the period totaled 3.05 inches statewide which was 1.4
inches below normal and 69% of normal. Precipitation totals by climate division, West
2.61 inches, Central 2.95 inches, Bluegrass 3.31 inches and East 3.34 inches, which
was 2.27, 1.87, 0.56 and 0.89 inches below normal. By station, precipitation totals
ranged from a low of 1.69 inches at BOWLING GREEN APT to a high of 4.89 inches at
BARBOURVILLE 3E.
* = Based on preliminary data
Summarized and averaged data for the period 20141201 to 20141231(Last 31 Days)
(Not for Legal purposes. Departure from Norms based on climate divisional Averages)
AIR TEMPERATURE PRECIPITATION ExtremeTemp
STATION MAX DEV MIN DEV AVR DEV TOTAL DEV %NORM HI LO
--------------------------------------------------------------------------------
WEST(CD1) 46 -2 35 5 41 2 2.61 -2.27 53 66 17
CENTRAL(CD2) 47 0 34 5 41 3 2.95 -1.87 61 66 16
BLUEGRASS(CD3) 45 -1 33 5 39 2 3.31 -0.56 86 65 13
EAST(CD4) 47 -1 34 6 41 3 3.34 -0.89 79 69 16
--------------------------------------------------------------------------------
STATE 46 -1 34 5 40 2 3.05 -1.40 69 69 13
===
Kentucky Climate Summary
For the Period: November 2014
Much Below Normal Temperatures and Precipitation: *
Unseasonably cold temperatures filtered into the Bluegrass State for much of
November. In fact, according to preliminary data, it was the 4th coldest November on
record for Kentucky, with data going back to 1895. The first day of the month saw
high pressure of Canadian origin build overhead. A combination of clear skies and
calm winds amounted to a statewide killing freeze, bringing an end to the 2014
growing season. The next significant bout of cold air came over the month's midsection
and lasted for much of the remaining month. The Commonwealth saw two straight week's
where the average state temperature was 11 degrees below normal. This was the two
largest below normal deviations the state had seen all year. Each week saw an Arctic
outbreak with multiple days in which highs only rose into the 30s.
Part of this period included an early season winter storm, which pushed into the
Bluegrass State on the night of the 16th. Rain transitioned to snow on the backside
of low pressure meandering up the Appalachian Mountains. Snowfall totals were most
significant along the Ohio River, where some saw 3 to 5 inches of snow.
Accumulations then generally decreased to the southeast. Below are a couple images
developed by the National Weather Service office in Louisville. The image on the
left shows snowfall totals for central portion of the state, while the other displays
the extent of snow cover across the Ohio Valley through satellite imagery.
The winter weather event was then followed by the coldest air of the fall season.
Lows on the night of the 17th and 18th (figures below) dropped into the low to mid
teens for most. Some locations even dipped into the single digits. Highs on the 18th
only rose into the low to mid 20s, about 30 degrees below normal for that time of the
year. The 48 hour period of very cold temperatures and wind chills approaching zero
pushed the livestock cold stress index into the emergency category.
The driest period occurred over the second week of December. The majority of the
state saw at most, a couple hundredths of rainfall. Precipitation was over an inch
below normal, which was the most significant weekly departure seen all year. Looking
at precipitation type, it was quite the difference from December 2013. Kentucky saw
little in the way of wintry weather with mild temperatures in place. Lexington,
Louisville, Bowling Green, and Jackson each received just a trace of snow.
Temperatures for the period averaged 40 degrees across the state which was 2 degrees
warmer than normal. High temperatures averaged from 46 in the West to 47 in the
East. Departure from normal high temperatures ranged from 2 degrees cooler than
normal in the West to 1 degree cooler than normal in the East. Low temperatures
averaged from 35 degrees in the West to 34 degrees in the East. Departure from normal
low temperature ranged from 5 degrees warmer than normal in the West to 6 degrees
warmer than normal in the East. The extreme high temperature for the period was 69
at JACKSON 3SE and the extreme low was 13 at BURLINGTON 4S.
Precipitation (liq. equ.) for the period totaled 3.05 inches statewide which was 1.4
inches below normal and 69% of normal. Precipitation totals by climate division, West
2.61 inches, Central 2.95 inches, Bluegrass 3.31 inches and East 3.34 inches, which
was 2.27, 1.87, 0.56 and 0.89 inches below normal. By station, precipitation totals
ranged from a low of 1.69 inches at BOWLING GREEN APT to a high of 4.89 inches at
BARBOURVILLE 3E.
* = Based on preliminary data
Summarized and averaged data for the period 20141201 to 20141231(Last 31 Days)
(Not for Legal purposes. Departure from Norms based on climate divisional Averages)
AIR TEMPERATURE PRECIPITATION ExtremeTemp
STATION MAX DEV MIN DEV AVR DEV TOTAL DEV %NORM HI LO
--------------------------------------------------------------------------------
WEST(CD1) 46 -2 35 5 41 2 2.61 -2.27 53 66 17
CENTRAL(CD2) 47 0 34 5 41 3 2.95 -1.87 61 66 16
BLUEGRASS(CD3) 45 -1 33 5 39 2 3.31 -0.56 86 65 13
EAST(CD4) 47 -1 34 6 41 3 3.34 -0.89 79 69 16
--------------------------------------------------------------------------------
STATE 46 -1 34 5 40 2 3.05 -1.40 69 69 13
===
Kentucky Climate Summary
For the Period: November 2014
Much Below Normal Temperatures and Precipitation: *
Unseasonably cold temperatures filtered into the Bluegrass State for much of
November. In fact, according to preliminary data, it was the 4th coldest November on
record for Kentucky, with data going back to 1895. The first day of the month saw
high pressure of Canadian origin build overhead. A combination of clear skies and
calm winds amounted to a statewide killing freeze, bringing an end to the 2014
growing season. The next significant bout of cold air came over the month's midsection
and lasted for much of the remaining month. The Commonwealth saw two straight week's
where the average state temperature was 11 degrees below normal. This was the two
largest below normal deviations the state had seen all year. Each week saw an Arctic
outbreak with multiple days in which highs only rose into the 30s.
Part of this period included an early season winter storm, which pushed into the
Bluegrass State on the night of the 16th. Rain transitioned to snow on the backside
of low pressure meandering up the Appalachian Mountains. Snowfall totals were most
significant along the Ohio River, where some saw 3 to 5 inches of snow.
Accumulations then generally decreased to the southeast. Below are a couple images
developed by the National Weather Service office in Louisville. The image on the
left shows snowfall totals for central portion of the state, while the other displays
the extent of snow cover across the Ohio Valley through satellite imagery.
The winter weather event was then followed by the coldest air of the fall season.
Lows on the night of the 17th and 18th (figures below) dropped into the low to mid
teens for most. Some locations even dipped into the single digits. Highs on the 18th
only rose into the low to mid 20s, about 30 degrees below normal for that time of the
year. The 48 hour period of very cold temperatures and wind chills approaching zero
pushed the livestock cold stress index into the emergency category.
 As stated earlier, the winter-like pattern remained in place for the rest of the
month. By the end of November, the state had gone 6 straight weeks of seeing below
normal temperatures. Accompanying the cold month was rather dry conditions. While
the state did see numerous rounds of precipitation, totals were fairly minimal with
most seeing a little more than two inches. This amounted to the 3rd driest month of
the past year for Kentucky.
Temperatures for the period averaged 41 degrees across the state which was 7 degrees
cooler than normal. High temperatures averaged from 50 in the West to 50 in the
East. Departure from normal high temperatures ranged from 9 degrees cooler than
normal in the West to 9 degrees cooler than normal in the East. Low temperatures
averaged from 32 degrees in the West to 32 degrees in the East. Departure from
normal low temperature ranged from 6 degrees cooler than normal in the West to 2
degrees cooler than normal in the East. The extreme high temperature for the period
was 74 at BIG SANDY and the extreme low was 2 at HENDERSON 5E. Preliminary data
shows that November 2014 was the 4th coldest on record for the Bluegrass State.
Precipitation (liq. equ.) for the period totaled 2.39 inches statewide which was 1.51
inches below normal and 61% of normal. Precipitation totals by climate division, West
2.12 inches, Central 2.66 inches, Bluegrass 2.08 inches and East 2.70 inches, which
was 2.4, 1.45, 1.33 and 0.88 inches below normal. By station, precipitation totals
ranged from a low of 1.50 inches at OWENSBORO AWSS to a high of 3.65 inches at COLUMBIA 3N.
* = Based on preliminary data
Summarized and averaged data for the period 20141101 to 20141130(Last 30 Days)
(Not for Legal purposes. Departure from Norms based on climate divisional Averages)
AIR TEMPERATURE PRECIPITATION ExtremeTemp
STATION MAX DEV MIN DEV AVR DEV TOTAL DEV %NORM HI LO
--------------------------------------------------------------------------------
WEST(CD1) 50 -9 32 -6 41 -8 2.12 -2.40 47 71 2
CENTRAL(CD2) 50 -8 33 -4 41 -7 2.66 -1.45 65 72 7
BLUEGRASS(CD3) 48 -9 31 -6 40 -7 2.08 -1.33 61 71 4
EAST(CD4) 50 -9 32 -2 41 -6 2.70 -0.88 75 74 8
--------------------------------------------------------------------------------
STATE 50 -8 32 -4 41 -7 2.39 -1.51 61 74 2
===
Kentucky Climate Summary
For the Period: October 2014
Below Normal Temperatures and Much Above Normal Precipitation: *
Going into the month of October, rain was needed across much of the state. Pasture
conditions were diminishing and late planted soybeans were beginning to show some
signs of stress. According to the National Weather Service in Louisville, the city
of Louisville had not seen any measurable rainfall for 20 straight days as of October
1st, while Lexington had a streak of 16 days. Just as conditions were beginning to
look grim, the tide shifted and a wet pattern ensued for much of October. Normally
one of the driest months of the year for the Bluegrass State, October was nearly the
exact opposite in 2014. Over the course of the month, preliminary data shows that
the state averaged 5.75 inches of precipitation. This is over 2 inches above normal
and as it stands now, would rank as the 5th wettest October on record for Kentucky.
Jackson and London Kentucky each saw monthly rainfall records broken with 7.77 and
8.35 inches, respectively.
Most of the rainfall fell over the second and third week of the month with each
period averaging over 2 inches across the state. Multiple disturbances passed
through the Commonwealth between the 6th and the 12th, each sparking scattered to
numerous showers and storms across the region. The most significant event came
through the afternoon and evening hours on October 7th as thunderstorms produced
large hail, damaging winds, and multiple tornadoes. Over the course of the episode,
9 tornadoes were confirmed, all of which were rated weak in nature. In addition,
there were numerous reports of hail greater than the size of a golf ball, some of
which damaged the corn and tobacco crop, especially in the Bluegrass Region. The
following week kept the wet pattern in place. A cold front made slow progress across
the state over the 13th and 14th, with rainfall widespread in coverage. Most picked
up another 1 to 3 inches with the passage. Conditions then became dry for much of
the remainder of the month with focus turning towards temperatures and moving along
with a delayed harvest.
Throughout the month, Kentucky did see a fair share of warm and cool days. The first
week was a prime example as the mercury rose into the mid to upper 80s ahead of a
cold front, before a frost advisory was warranted a few days later as lows dropped
into the low to mid 30s. This event was not widespread enough to officially end the
growing season. The Commonwealth then went the remainder of the month with no real
threats to agriculture and would mark a late end to the growing season.
Temperatures for the period averaged 58 degrees across the state which was near
normal. High temperatures averaged from 70 in the West to 66 in the East. Departure
from normal high temperatures ranged from 2 degrees cooler than normal in the West to
4 degrees cooler than normal in the East. Low temperatures averaged from 49 degrees
in the West to 48 degrees in the East. Departure from normal low temperature ranged
from 2 degrees warmer than normal in the West to 5 degrees warmer than normal in the
East. The extreme high temperature for the period was 91 at OWENSBORO AWSS and the
extreme low was 27 at FORT CAMPBELL.
Precipitation (liq. equ.) for the period totaled 5.31 inches statewide which was 2.01
inches above normal and 161% of normal. Precipitation totals by climate division,
West 5.00 inches, Central 5.13 inches, Bluegrass 4.64 inches and East 6.49 inches,
which was 1.49, 1.73, 1.55 and 3.28 inches above normal. By station, precipitation
totals ranged from a low of 2.80 inches at CARBONDALE ASOS to a high of 9.56
inches at YELLOW CREEK.
* = Based on preliminary data
Summarized and averaged data for the period 20141001 to 20141031(Last 31 Days)
(Not for Legal purposes. Departure from Norms based on climate divisional Averages)
AIR TEMPERATURE PRECIPITATION ExtremeTemp
STATION MAX DEV MIN DEV AVR DEV TOTAL DEV %NORM HI LO
--------------------------------------------------------------------------------
WEST(CD1) 70 -2 49 2 60 1 5.00 1.49 142 91 27
CENTRAL(CD2) 68 -2 48 2 58 0 5.13 1.73 151 89 30
BLUEGRASS(CD3) 65 -4 48 2 57 0 4.64 1.55 150 88 32
EAST(CD4) 66 -4 48 5 57 0 6.49 3.28 202 88 31
--------------------------------------------------------------------------------
STATE 67 -3 48 2 58 0 5.31 2.01 161 91 27
===
Kentucky Climate Summary
For the Period: September 2014
Below Normal Temperatures and Precipitation: *
Very dry conditions took control of the Bluegrass State over this past September.
While it is typically one of the driest months out of the year, the Commonwealth still
saw well below normal rainfall with an average of just 1.83 inches falling across the
state. Data has to be drawn all the way back to November of 2012 to find a drier
month. Preliminary data suggests it was the 16th driest September on record, going all
the way back to 1895.
There was only a few instances through the early stages of the month when the
Commonwealth received some significant rainfall. Two cold fronts over the first week
of the month sparked scattered to numerous showers and storms across the eastern half
of the state. This section of Kentucky received over an inch on average, while the
western half of the state got left out. The second week of the month was the only
period where most of the Commonwealth saw some beneficial rainfall. Another cold front
sparked widespread showers and storms across the region on the 11th. Situated within a
very moist air mass, rainfall was moderate to heavy at times. Many locations in
North-Central Kentucky and the Bluegrass received between 1.5 to 3 inches. Daily
rainfall records were broke at Lexington, Louisville, and Frankfort with each city
getting more than 2.5 inches. The map below was created by the National Weather
Service in Louisville, showing the extensive rainfall totals across the region over
the course of the event.
As stated earlier, the winter-like pattern remained in place for the rest of the
month. By the end of November, the state had gone 6 straight weeks of seeing below
normal temperatures. Accompanying the cold month was rather dry conditions. While
the state did see numerous rounds of precipitation, totals were fairly minimal with
most seeing a little more than two inches. This amounted to the 3rd driest month of
the past year for Kentucky.
Temperatures for the period averaged 41 degrees across the state which was 7 degrees
cooler than normal. High temperatures averaged from 50 in the West to 50 in the
East. Departure from normal high temperatures ranged from 9 degrees cooler than
normal in the West to 9 degrees cooler than normal in the East. Low temperatures
averaged from 32 degrees in the West to 32 degrees in the East. Departure from
normal low temperature ranged from 6 degrees cooler than normal in the West to 2
degrees cooler than normal in the East. The extreme high temperature for the period
was 74 at BIG SANDY and the extreme low was 2 at HENDERSON 5E. Preliminary data
shows that November 2014 was the 4th coldest on record for the Bluegrass State.
Precipitation (liq. equ.) for the period totaled 2.39 inches statewide which was 1.51
inches below normal and 61% of normal. Precipitation totals by climate division, West
2.12 inches, Central 2.66 inches, Bluegrass 2.08 inches and East 2.70 inches, which
was 2.4, 1.45, 1.33 and 0.88 inches below normal. By station, precipitation totals
ranged from a low of 1.50 inches at OWENSBORO AWSS to a high of 3.65 inches at COLUMBIA 3N.
* = Based on preliminary data
Summarized and averaged data for the period 20141101 to 20141130(Last 30 Days)
(Not for Legal purposes. Departure from Norms based on climate divisional Averages)
AIR TEMPERATURE PRECIPITATION ExtremeTemp
STATION MAX DEV MIN DEV AVR DEV TOTAL DEV %NORM HI LO
--------------------------------------------------------------------------------
WEST(CD1) 50 -9 32 -6 41 -8 2.12 -2.40 47 71 2
CENTRAL(CD2) 50 -8 33 -4 41 -7 2.66 -1.45 65 72 7
BLUEGRASS(CD3) 48 -9 31 -6 40 -7 2.08 -1.33 61 71 4
EAST(CD4) 50 -9 32 -2 41 -6 2.70 -0.88 75 74 8
--------------------------------------------------------------------------------
STATE 50 -8 32 -4 41 -7 2.39 -1.51 61 74 2
===
Kentucky Climate Summary
For the Period: October 2014
Below Normal Temperatures and Much Above Normal Precipitation: *
Going into the month of October, rain was needed across much of the state. Pasture
conditions were diminishing and late planted soybeans were beginning to show some
signs of stress. According to the National Weather Service in Louisville, the city
of Louisville had not seen any measurable rainfall for 20 straight days as of October
1st, while Lexington had a streak of 16 days. Just as conditions were beginning to
look grim, the tide shifted and a wet pattern ensued for much of October. Normally
one of the driest months of the year for the Bluegrass State, October was nearly the
exact opposite in 2014. Over the course of the month, preliminary data shows that
the state averaged 5.75 inches of precipitation. This is over 2 inches above normal
and as it stands now, would rank as the 5th wettest October on record for Kentucky.
Jackson and London Kentucky each saw monthly rainfall records broken with 7.77 and
8.35 inches, respectively.
Most of the rainfall fell over the second and third week of the month with each
period averaging over 2 inches across the state. Multiple disturbances passed
through the Commonwealth between the 6th and the 12th, each sparking scattered to
numerous showers and storms across the region. The most significant event came
through the afternoon and evening hours on October 7th as thunderstorms produced
large hail, damaging winds, and multiple tornadoes. Over the course of the episode,
9 tornadoes were confirmed, all of which were rated weak in nature. In addition,
there were numerous reports of hail greater than the size of a golf ball, some of
which damaged the corn and tobacco crop, especially in the Bluegrass Region. The
following week kept the wet pattern in place. A cold front made slow progress across
the state over the 13th and 14th, with rainfall widespread in coverage. Most picked
up another 1 to 3 inches with the passage. Conditions then became dry for much of
the remainder of the month with focus turning towards temperatures and moving along
with a delayed harvest.
Throughout the month, Kentucky did see a fair share of warm and cool days. The first
week was a prime example as the mercury rose into the mid to upper 80s ahead of a
cold front, before a frost advisory was warranted a few days later as lows dropped
into the low to mid 30s. This event was not widespread enough to officially end the
growing season. The Commonwealth then went the remainder of the month with no real
threats to agriculture and would mark a late end to the growing season.
Temperatures for the period averaged 58 degrees across the state which was near
normal. High temperatures averaged from 70 in the West to 66 in the East. Departure
from normal high temperatures ranged from 2 degrees cooler than normal in the West to
4 degrees cooler than normal in the East. Low temperatures averaged from 49 degrees
in the West to 48 degrees in the East. Departure from normal low temperature ranged
from 2 degrees warmer than normal in the West to 5 degrees warmer than normal in the
East. The extreme high temperature for the period was 91 at OWENSBORO AWSS and the
extreme low was 27 at FORT CAMPBELL.
Precipitation (liq. equ.) for the period totaled 5.31 inches statewide which was 2.01
inches above normal and 161% of normal. Precipitation totals by climate division,
West 5.00 inches, Central 5.13 inches, Bluegrass 4.64 inches and East 6.49 inches,
which was 1.49, 1.73, 1.55 and 3.28 inches above normal. By station, precipitation
totals ranged from a low of 2.80 inches at CARBONDALE ASOS to a high of 9.56
inches at YELLOW CREEK.
* = Based on preliminary data
Summarized and averaged data for the period 20141001 to 20141031(Last 31 Days)
(Not for Legal purposes. Departure from Norms based on climate divisional Averages)
AIR TEMPERATURE PRECIPITATION ExtremeTemp
STATION MAX DEV MIN DEV AVR DEV TOTAL DEV %NORM HI LO
--------------------------------------------------------------------------------
WEST(CD1) 70 -2 49 2 60 1 5.00 1.49 142 91 27
CENTRAL(CD2) 68 -2 48 2 58 0 5.13 1.73 151 89 30
BLUEGRASS(CD3) 65 -4 48 2 57 0 4.64 1.55 150 88 32
EAST(CD4) 66 -4 48 5 57 0 6.49 3.28 202 88 31
--------------------------------------------------------------------------------
STATE 67 -3 48 2 58 0 5.31 2.01 161 91 27
===
Kentucky Climate Summary
For the Period: September 2014
Below Normal Temperatures and Precipitation: *
Very dry conditions took control of the Bluegrass State over this past September.
While it is typically one of the driest months out of the year, the Commonwealth still
saw well below normal rainfall with an average of just 1.83 inches falling across the
state. Data has to be drawn all the way back to November of 2012 to find a drier
month. Preliminary data suggests it was the 16th driest September on record, going all
the way back to 1895.
There was only a few instances through the early stages of the month when the
Commonwealth received some significant rainfall. Two cold fronts over the first week
of the month sparked scattered to numerous showers and storms across the eastern half
of the state. This section of Kentucky received over an inch on average, while the
western half of the state got left out. The second week of the month was the only
period where most of the Commonwealth saw some beneficial rainfall. Another cold front
sparked widespread showers and storms across the region on the 11th. Situated within a
very moist air mass, rainfall was moderate to heavy at times. Many locations in
North-Central Kentucky and the Bluegrass received between 1.5 to 3 inches. Daily
rainfall records were broke at Lexington, Louisville, and Frankfort with each city
getting more than 2.5 inches. The map below was created by the National Weather
Service in Louisville, showing the extensive rainfall totals across the region over
the course of the event.
 Behind the front, cool conditions were driven into the Bluegrass State. Highs were
well below normal with temperatures peaking in the mid to upper 60s for a couple days.
In addition, lows dropped down into the low to mid 40s for many locations, giving the
Commonwealth a first taste of fall. The second half of the month followed this cool
trend with temperatures remaining below normal each week with highs typically staying
in the 70s. This was accompanied by mostly dry conditions as surface high pressure
took control. In fact, the last full period of the month that ran from September 22nd
to the 28th, ended with a state average of 0.00 inches. Many cities across the
Commonwealth, including Lexington, Louisville, and Jackson saw no measurable
precipitation over the latter half of the month. While the dry conditions allowed for
good progress on corn harvest, the USDA Kentucky Crop Progress and Condition Report
stated that the lack of rain has some late planted soybeans showing signs of stress.
Temperatures for the period averaged 68 degrees across the state which was 1 degree
cooler than normal. High temperatures averaged from 80 in the West to 77 in the
East. Departure from normal high temperatures ranged from 2 degrees cooler than
normal in the West to 3 degrees cooler than normal in the East. Low temperatures
averaged from 58 degrees in the West to 59 degrees in the East. Departure from
normal low temperature ranged from 1 degree cooler than normal in the West to 3
degrees warmer than normal in the East. The extreme high temperature for the period
was 95 at PADUCAH ASOS and the extreme low was 37 at CADIZ 4SW.
Precipitation (liq. equ.) for the period totaled 1.83 inches statewide which was 1.69
inches below normal and 52% of normal. Precipitation totals by climate division, West
1.31 inches, Central 1.02 inches, Bluegrass 2.60 inches and East 2.40 inches, which
was 2.18, 2.85, 0.62 and 1.08 inches below normal. By station, precipitation totals
ranged from a low of 0.12 inches at RUSSELLVILLE 2W to a high of 4.76 inches at
PAINTSVILLE 4W.
* = Based on preliminary data
Summarized and averaged data for the period 20140901 to 20140930(Last 30 Days)
(Not for Legal purposes. Departure from Norms based on climate divisional Averages)
AIR TEMPERATURE PRECIPITATION ExtremeTemp
STATION MAX DEV MIN DEV AVR DEV TOTAL DEV %NORM HI LO
--------------------------------------------------------------------------------
WEST(CD1) 80 -2 58 -1 69 -2 1.31 -2.18 38 95 37
CENTRAL(CD2) 80 -1 58 0 69 0 1.02 -2.85 26 93 39
BLUEGRASS(CD3) 78 -2 57 0 67 -1 2.60 -0.62 81 91 37
EAST(CD4) 77 -3 59 3 68 0 2.40 -1.08 69 91 39
--------------------------------------------------------------------------------
STATE 79 -2 58 0 68 -1 1.83 -1.69 52 95 37
===
Kentucky Climate Summary
For the Period: August 2014
Near Normal Temperatures and Much Above Normal Precipitation: *
Much of the summer has been dominated by a cool pattern, with Mother Nature giving
few glimpses of high heat and humidity. That tide shifted as the month of August
progressed. The first heat wave of the summer pushed into the Commonwealth over the
third week of the month as an upper level ridge of high pressure built into the Ohio
Valley. Temperatures ranged from the upper 80s to middle 90s at times when looking
east to west across the Commonwealth. Dewpoints well into the 70s helped shove the
heat index above the century mark on multiple occasions across Western Kentucky.
This sent the livestock heat stress index into the danger to emergency category
statewide. The heat spell broke a streak of 7 straight weeks where below normal
temperatures were felt across the state.
Accompanying the warmer conditions was a wet pattern, which was present for nearly
the entire month. Other than the Purchase area, much of the state saw drought
conditions diminish throughout August. This came as the state was placed within a
very moist air mass, which allowed for efficient rainfall producing storms. In one
case, Lexington saw over 2 inches fall within 1 hour. The most significant period
came the third week of the month as scattered showers and storms developed on a daily
basis. Overall, this period led the way in pushing the Commonwealth to the 11th
wettest August on record with data going back to 1895. Precipitation totaled 5.81
inches, which was over 2 inches above normal.
Temperatures for the period averaged 76 degrees across the state which was near
normal. High temperatures averaged from 88 in the West to 82 in the East. Departure
from normal high temperatures ranged from near normal in the West to 4 degrees
cooler than normal in the East. Low temperatures averaged from 67 degrees in the
West to 65 degrees in the East. Departure from normal low temperature ranged from 1
degree warmer than normal in the West to 3 degrees warmer than normal in the East.
The extreme high temperature for the period was 98 at MAYFIELD 6SW and the extreme
low was 48 at CYNTHIANA 8N.
Precipitation (liq. equ.) for the period totaled 5.81 inches statewide which was 2.02
inches above normal and 153% of normal. Precipitation totals by climate division,
West 4.96 inches, Central 6.93 inches, Bluegrass 5.09 inches and East 6.27 inches,
which was 1.44, 3.16, 1.32 and 2.17 inches above normal. By station, precipitation
totals ranged from a low of 1.10 inches at POPLAR BLUFF ASOS
to a high of 11.70 inches at GREENVILLE 6N.
* = Based on preliminary data
Summarized and averaged data for the period 20140801 to 20140831(Last 31 Days)
(Not for Legal purposes. Departure from Norms based on climate divisional Averages)
AIR TEMPERATURE PRECIPITATION ExtremeTemp
STATION MAX DEV MIN DEV AVR DEV TOTAL DEV %NORM HI LO
--------------------------------------------------------------------------------
WEST(CD1) 88 0 67 1 78 1 4.96 1.44 141 98 51
CENTRAL(CD2) 85 -2 66 1 76 0 6.93 3.16 184 94 53
BLUEGRASS(CD3) 83 -2 65 1 74 -1 5.09 1.32 135 92 48
EAST(CD4) 82 -4 65 3 74 0 6.27 2.17 153 92 48
--------------------------------------------------------------------------------
STATE 84 -2 66 2 76 0 5.81 2.02 153 98 48
===
Kentucky Climate Summary
For the Period: July 2014
Much Below Normal Temperatures and Below Normal Precipitation: *
Did Mother Nature forget about summer? It felt more like September for a good share
of July as the Commonwealth got wedged in an unseasonably cool pattern. In fact,
this was one of the coolest July month's ever recorded for the Bluegrass State.
Based on preliminary data, this month would rank in the top 10 for coolest July's on
record, going back to 1895. It was actually cooler than June as each week saw the
average state temperature as near to below normal.
It seems that the only week that followed a typical summer pattern was the second
week of July. Temperatures hovered around normal for much of the week, before high
pressure meandered east over the 12th and 13th, pushing the mercury into the low to
mid 90s. The combination of extreme heat and high humidity put the heat index around
100 degrees and sent the livestock heat stress index into the danger category for
much of the area. The warmest temperature was recorded in Louisville, which hit a
high of 97 degrees. The scorching heat was then followed by a strong cold front.
Temperatures cooled into the 70s for daytime highs and were accompanied by low
dewpoints, giving the feel that fall had arrived. Record low temperatures were
broken on a couple occasions for many locations. The first came on the night of the
16th with lows dropping into the low to mid 50s. Some locations even dropped into
the upper 40s. The second came on the night of the 28th with similar lows in place as
a Canadian air mass sunk into the Lower Ohio Valley.
Depending on the location, it was either a dry or wet July. As July started out,
Eastern Kentucky was looking to receive some rain. Most of the area was abnormally
dry with even a slight portion of Eastern Kentucky in moderate drought. This slowly
improved over the course of the month, thanks in large part to a couple weeks of
above normal rainfall over July's midsection. Eastern Kentucky averaged nearly 3
inches over the third week of the month, followed by another period with over an inch
and a half. As the eastern half of the state showed improvement, the western half
went in the opposite direction. By the end of July, Western Kentucky had gone 7
straight weeks of seeing below normal rainfall. The lack of moisture had sent much
of West-Central Kentucky into a Moderate Drought.
The Commonwealth also saw a fair share of severe weather throughout the month. The
most significant event came over the course of the 26th and 27th as a line of storms
swept across the eastern half of the state, followed by more discrete activity on
Sunday. Both were accompanies by isolated reports of damaging winds and large hail.
Portions of Lexington saw straight line winds around 95 mph, while one report from
Leslie County measured hail at over 4 inches in diameter, nearly the size of a
softball.
Temperatures for the period averaged 73 degrees across the state which was 4 degrees
cooler than normal. High temperatures averaged from 84 in the West to 82 in the
East. Departure from normal high temperatures ranged from 5 degrees cooler than
normal in the West to 5 degrees cooler than normal in the East. Low temperatures
averaged from 63 degrees in the West to 63 degrees in the East. Departure from
normal low temperature ranged from 4 degrees cooler than normal in the West to near
normal in the East. The extreme high temperature for the period was 97 at HARTFORD 3E
and the extreme low was 48 at BLACK MOUNTAIN ARC.
Precipitation (liq. equ.) for the period totaled 3.46 inches statewide which was 0.89
inches below normal and 80% of normal. Precipitation totals by climate division, West
1.80 inches, Central 3.03 inches, Bluegrass 3.76 inches and East 5.27 inches, which
was -2.44, -1.35, -0.50 and 0.77 inches respectively from normal. By station,
precipitation totals ranged from a low of 0.53 inches at MAYFIELD 6SW to a high of
8.73 inches at WHITLEY CITY 3N.
* = Based on preliminary data
Summarized and averaged data for the period 20140701 to 20140731(Last 31 Days)
(Not for Legal purposes. Departure from Norms based on climate divisional Averages)
AIR TEMPERATURE PRECIPITATION ExtremeTemp
STATION MAX DEV MIN DEV AVR DEV TOTAL DEV %NORM HI LO
--------------------------------------------------------------------------------
WEST(CD1) 84 -5 63 -4 74 -4 1.80 -2.44 42 97 49
CENTRAL(CD2) 84 -4 63 -3 73 -4 3.03 -1.35 69 97 49
BLUEGRASS(CD3) 82 -4 62 -3 72 -4 3.76 -0.50 88 96 49
EAST(CD4) 82 -5 63 0 72 -3 5.27 0.77 117 97 48
--------------------------------------------------------------------------------
STATE 83 -4 63 -2 73 -4 3.46 -0.89 80 97 48
===
Kentucky Climate Summary
For the Period: June 2014
Above Normal Temperatures and Below Normal Precipitation: *
Dry conditions started to deepen across the Lower Ohio Valley over the course of
June. The Commonwealth was nearly an inch below normal for the month, with the state
averaging just over three and half inches. This occurred following a dry April and
with the extended period of dry conditions; impacts are starting to be felt. This is
especially the case across Central and Eastern Kentucky, where most of the region has
been labeled 'abnormally dry' by the US Drought Monitor. A slight portion of extreme
southeastern portions of the state is even in a 'Moderate Drought', something that
the state has not seen since January of 2013. This was well represented with the
rainfall patterns over the course of the month. One of the few major rainfall events
occurred the first week of June. Western Kentucky received over two and a half
inches over the course of the week, but the spatial coverage stopped there. Both
Central and Eastern portions of Kentucky received less than inch on average.
It was also a warm June across the Bluegrass State. After withstanding a very harsh
and cold winter, conditions have taken a 180 degree turn. Since April, every month
has seen the average temperature 2 degrees above normal. Temperatures were already
peaking in the 80s at the start of the month, but this became an understatement over
the second half of June, as the 90s were seen across a great deal of days. The
highest temperature was recorded at 94 degrees for each climate division across
Kentucky (Western, Central, Bluegrass, and Eastern). Accompanying the heat was the
one missing ingredient to really give a feel of summer here in the Lower Ohio Valley;
humidity. Dewpoints rose into the upper 60s to mid-70s on multiple occasions, which
just helped in sending the heat index into the triple digits at times. This pushed
the livestock heat stress index into the danger category each afternoon and evening.
Some locations, especially across Western Kentucky, saw the emergency category over
the last week of the month.
Temperatures for the period averaged 74 degrees across the state which was 2 degrees
warmer than normal. High temperatures averaged from 84 in the West to 83 in the East.
Departure from normal high temperatures ranged from 2 degrees cooler than normal in
the West to near normal in the East. Low temperatures averaged from 67
degrees in the West to 63 degrees in the East. Departure from normal low temperature
ranged from 4 degrees warmer than normal in the West to 4 degrees warmer than normal
in the East. The extreme high temperature for the period was 94 at BOWLING GREEN APT
and the extreme low was 44 at CYNTHIANA 8N.
Precipitation (liq. equ.) for the period totaled 3.58 inches statewide which was 0.84
inches below normal and 81% of normal. Precipitation totals by climate division, West
4.86 inches, Central 2.65 inches, Bluegrass 3.63 inches and East 3.20 inches, which
was 0.55, -1.78, -0.80 and -1.30 inches respectively from normal. By station,
precipitation totals ranged from a low of 1.10 inches at BOWLING GREEN 5S to a high
of 9.99 inches at MAYFIELD 6SW.
* = Based on preliminary data
Summarized and averaged data for the period 20140601 to 20140630(Last 30 Days)
(Not for Legal purposes. Departure from Norms based on climate divisional Averages)
AIR TEMPERATURE PRECIPITATION ExtremeTemp
STATION MAX DEV MIN DEV AVR DEV TOTAL DEV %NORM HI LO
--------------------------------------------------------------------------------
WEST(CD1) 84 -2 67 4 76 2 4.86 0.55 113 94 48
CENTRAL(CD2) 84 0 65 3 75 2 2.65 -1.78 60 94 46
BLUEGRASS(CD3) 83 0 64 3 73 1 3.63 -0.80 82 94 44
EAST(CD4) 83 0 63 4 73 2 3.20 -1.30 71 94 47
--------------------------------------------------------------------------------
STATE 84 0 65 4 74 2 3.58 -0.84 81 94 44
===
Kentucky Climate Summary
For the Period: May 2014
Above Normal Temperatures and Much Below Normal Precipitation: *
After a very wet April, an unseasonable dry and warm pattern setup across the Lower
Ohio Valley for the month of May. This year, the state averaged only 3.32 inches for
the month, which is nearly 1.5 below normal. On an average year, Kentucky sees over 5
inches of rainfall throughout May, which is typically the wettest month of the year.
This significant lull in precipitation caused the 2nd highest below normal deviation
over the past year. In doing so, extreme southeastern portions of the state are now
beginning to show abnormally dry conditions according to the latest US Drought
Monitor.
May started off very quiet with the first weekend of the month yielding to mostly
sunny skies and warmer temperatures, more typical of early summer. Temperatures were
well above normal in some locations, especially Paducah that got to a high of 88.
The weather pattern really didn't become very active until the mid-section of
the month. The most significant round came as an upper level low moved into the Ohio
Valley from the 14th to the 16th. Multiple disturbances rotated around this feature,
sparking numerous rounds of showers and storms. Some severe weather accompanied the
widespread rainfall with multiple reports of flooding and hail around 1 inch in
diameter. An EF2 tornado was even confirmed in Christian County with estimated peak
winds of 125 mph. Another event on May 22nd produced some damaging winds. The picture
below was taken from a storm survey performed by the National Weather Service in
Louisville, where a grain silo was damaged on the northwest side of Campbellsville.
Estimated peak winds were 70 to 75 mph.
Behind the front, cool conditions were driven into the Bluegrass State. Highs were
well below normal with temperatures peaking in the mid to upper 60s for a couple days.
In addition, lows dropped down into the low to mid 40s for many locations, giving the
Commonwealth a first taste of fall. The second half of the month followed this cool
trend with temperatures remaining below normal each week with highs typically staying
in the 70s. This was accompanied by mostly dry conditions as surface high pressure
took control. In fact, the last full period of the month that ran from September 22nd
to the 28th, ended with a state average of 0.00 inches. Many cities across the
Commonwealth, including Lexington, Louisville, and Jackson saw no measurable
precipitation over the latter half of the month. While the dry conditions allowed for
good progress on corn harvest, the USDA Kentucky Crop Progress and Condition Report
stated that the lack of rain has some late planted soybeans showing signs of stress.
Temperatures for the period averaged 68 degrees across the state which was 1 degree
cooler than normal. High temperatures averaged from 80 in the West to 77 in the
East. Departure from normal high temperatures ranged from 2 degrees cooler than
normal in the West to 3 degrees cooler than normal in the East. Low temperatures
averaged from 58 degrees in the West to 59 degrees in the East. Departure from
normal low temperature ranged from 1 degree cooler than normal in the West to 3
degrees warmer than normal in the East. The extreme high temperature for the period
was 95 at PADUCAH ASOS and the extreme low was 37 at CADIZ 4SW.
Precipitation (liq. equ.) for the period totaled 1.83 inches statewide which was 1.69
inches below normal and 52% of normal. Precipitation totals by climate division, West
1.31 inches, Central 1.02 inches, Bluegrass 2.60 inches and East 2.40 inches, which
was 2.18, 2.85, 0.62 and 1.08 inches below normal. By station, precipitation totals
ranged from a low of 0.12 inches at RUSSELLVILLE 2W to a high of 4.76 inches at
PAINTSVILLE 4W.
* = Based on preliminary data
Summarized and averaged data for the period 20140901 to 20140930(Last 30 Days)
(Not for Legal purposes. Departure from Norms based on climate divisional Averages)
AIR TEMPERATURE PRECIPITATION ExtremeTemp
STATION MAX DEV MIN DEV AVR DEV TOTAL DEV %NORM HI LO
--------------------------------------------------------------------------------
WEST(CD1) 80 -2 58 -1 69 -2 1.31 -2.18 38 95 37
CENTRAL(CD2) 80 -1 58 0 69 0 1.02 -2.85 26 93 39
BLUEGRASS(CD3) 78 -2 57 0 67 -1 2.60 -0.62 81 91 37
EAST(CD4) 77 -3 59 3 68 0 2.40 -1.08 69 91 39
--------------------------------------------------------------------------------
STATE 79 -2 58 0 68 -1 1.83 -1.69 52 95 37
===
Kentucky Climate Summary
For the Period: August 2014
Near Normal Temperatures and Much Above Normal Precipitation: *
Much of the summer has been dominated by a cool pattern, with Mother Nature giving
few glimpses of high heat and humidity. That tide shifted as the month of August
progressed. The first heat wave of the summer pushed into the Commonwealth over the
third week of the month as an upper level ridge of high pressure built into the Ohio
Valley. Temperatures ranged from the upper 80s to middle 90s at times when looking
east to west across the Commonwealth. Dewpoints well into the 70s helped shove the
heat index above the century mark on multiple occasions across Western Kentucky.
This sent the livestock heat stress index into the danger to emergency category
statewide. The heat spell broke a streak of 7 straight weeks where below normal
temperatures were felt across the state.
Accompanying the warmer conditions was a wet pattern, which was present for nearly
the entire month. Other than the Purchase area, much of the state saw drought
conditions diminish throughout August. This came as the state was placed within a
very moist air mass, which allowed for efficient rainfall producing storms. In one
case, Lexington saw over 2 inches fall within 1 hour. The most significant period
came the third week of the month as scattered showers and storms developed on a daily
basis. Overall, this period led the way in pushing the Commonwealth to the 11th
wettest August on record with data going back to 1895. Precipitation totaled 5.81
inches, which was over 2 inches above normal.
Temperatures for the period averaged 76 degrees across the state which was near
normal. High temperatures averaged from 88 in the West to 82 in the East. Departure
from normal high temperatures ranged from near normal in the West to 4 degrees
cooler than normal in the East. Low temperatures averaged from 67 degrees in the
West to 65 degrees in the East. Departure from normal low temperature ranged from 1
degree warmer than normal in the West to 3 degrees warmer than normal in the East.
The extreme high temperature for the period was 98 at MAYFIELD 6SW and the extreme
low was 48 at CYNTHIANA 8N.
Precipitation (liq. equ.) for the period totaled 5.81 inches statewide which was 2.02
inches above normal and 153% of normal. Precipitation totals by climate division,
West 4.96 inches, Central 6.93 inches, Bluegrass 5.09 inches and East 6.27 inches,
which was 1.44, 3.16, 1.32 and 2.17 inches above normal. By station, precipitation
totals ranged from a low of 1.10 inches at POPLAR BLUFF ASOS
to a high of 11.70 inches at GREENVILLE 6N.
* = Based on preliminary data
Summarized and averaged data for the period 20140801 to 20140831(Last 31 Days)
(Not for Legal purposes. Departure from Norms based on climate divisional Averages)
AIR TEMPERATURE PRECIPITATION ExtremeTemp
STATION MAX DEV MIN DEV AVR DEV TOTAL DEV %NORM HI LO
--------------------------------------------------------------------------------
WEST(CD1) 88 0 67 1 78 1 4.96 1.44 141 98 51
CENTRAL(CD2) 85 -2 66 1 76 0 6.93 3.16 184 94 53
BLUEGRASS(CD3) 83 -2 65 1 74 -1 5.09 1.32 135 92 48
EAST(CD4) 82 -4 65 3 74 0 6.27 2.17 153 92 48
--------------------------------------------------------------------------------
STATE 84 -2 66 2 76 0 5.81 2.02 153 98 48
===
Kentucky Climate Summary
For the Period: July 2014
Much Below Normal Temperatures and Below Normal Precipitation: *
Did Mother Nature forget about summer? It felt more like September for a good share
of July as the Commonwealth got wedged in an unseasonably cool pattern. In fact,
this was one of the coolest July month's ever recorded for the Bluegrass State.
Based on preliminary data, this month would rank in the top 10 for coolest July's on
record, going back to 1895. It was actually cooler than June as each week saw the
average state temperature as near to below normal.
It seems that the only week that followed a typical summer pattern was the second
week of July. Temperatures hovered around normal for much of the week, before high
pressure meandered east over the 12th and 13th, pushing the mercury into the low to
mid 90s. The combination of extreme heat and high humidity put the heat index around
100 degrees and sent the livestock heat stress index into the danger category for
much of the area. The warmest temperature was recorded in Louisville, which hit a
high of 97 degrees. The scorching heat was then followed by a strong cold front.
Temperatures cooled into the 70s for daytime highs and were accompanied by low
dewpoints, giving the feel that fall had arrived. Record low temperatures were
broken on a couple occasions for many locations. The first came on the night of the
16th with lows dropping into the low to mid 50s. Some locations even dropped into
the upper 40s. The second came on the night of the 28th with similar lows in place as
a Canadian air mass sunk into the Lower Ohio Valley.
Depending on the location, it was either a dry or wet July. As July started out,
Eastern Kentucky was looking to receive some rain. Most of the area was abnormally
dry with even a slight portion of Eastern Kentucky in moderate drought. This slowly
improved over the course of the month, thanks in large part to a couple weeks of
above normal rainfall over July's midsection. Eastern Kentucky averaged nearly 3
inches over the third week of the month, followed by another period with over an inch
and a half. As the eastern half of the state showed improvement, the western half
went in the opposite direction. By the end of July, Western Kentucky had gone 7
straight weeks of seeing below normal rainfall. The lack of moisture had sent much
of West-Central Kentucky into a Moderate Drought.
The Commonwealth also saw a fair share of severe weather throughout the month. The
most significant event came over the course of the 26th and 27th as a line of storms
swept across the eastern half of the state, followed by more discrete activity on
Sunday. Both were accompanies by isolated reports of damaging winds and large hail.
Portions of Lexington saw straight line winds around 95 mph, while one report from
Leslie County measured hail at over 4 inches in diameter, nearly the size of a
softball.
Temperatures for the period averaged 73 degrees across the state which was 4 degrees
cooler than normal. High temperatures averaged from 84 in the West to 82 in the
East. Departure from normal high temperatures ranged from 5 degrees cooler than
normal in the West to 5 degrees cooler than normal in the East. Low temperatures
averaged from 63 degrees in the West to 63 degrees in the East. Departure from
normal low temperature ranged from 4 degrees cooler than normal in the West to near
normal in the East. The extreme high temperature for the period was 97 at HARTFORD 3E
and the extreme low was 48 at BLACK MOUNTAIN ARC.
Precipitation (liq. equ.) for the period totaled 3.46 inches statewide which was 0.89
inches below normal and 80% of normal. Precipitation totals by climate division, West
1.80 inches, Central 3.03 inches, Bluegrass 3.76 inches and East 5.27 inches, which
was -2.44, -1.35, -0.50 and 0.77 inches respectively from normal. By station,
precipitation totals ranged from a low of 0.53 inches at MAYFIELD 6SW to a high of
8.73 inches at WHITLEY CITY 3N.
* = Based on preliminary data
Summarized and averaged data for the period 20140701 to 20140731(Last 31 Days)
(Not for Legal purposes. Departure from Norms based on climate divisional Averages)
AIR TEMPERATURE PRECIPITATION ExtremeTemp
STATION MAX DEV MIN DEV AVR DEV TOTAL DEV %NORM HI LO
--------------------------------------------------------------------------------
WEST(CD1) 84 -5 63 -4 74 -4 1.80 -2.44 42 97 49
CENTRAL(CD2) 84 -4 63 -3 73 -4 3.03 -1.35 69 97 49
BLUEGRASS(CD3) 82 -4 62 -3 72 -4 3.76 -0.50 88 96 49
EAST(CD4) 82 -5 63 0 72 -3 5.27 0.77 117 97 48
--------------------------------------------------------------------------------
STATE 83 -4 63 -2 73 -4 3.46 -0.89 80 97 48
===
Kentucky Climate Summary
For the Period: June 2014
Above Normal Temperatures and Below Normal Precipitation: *
Dry conditions started to deepen across the Lower Ohio Valley over the course of
June. The Commonwealth was nearly an inch below normal for the month, with the state
averaging just over three and half inches. This occurred following a dry April and
with the extended period of dry conditions; impacts are starting to be felt. This is
especially the case across Central and Eastern Kentucky, where most of the region has
been labeled 'abnormally dry' by the US Drought Monitor. A slight portion of extreme
southeastern portions of the state is even in a 'Moderate Drought', something that
the state has not seen since January of 2013. This was well represented with the
rainfall patterns over the course of the month. One of the few major rainfall events
occurred the first week of June. Western Kentucky received over two and a half
inches over the course of the week, but the spatial coverage stopped there. Both
Central and Eastern portions of Kentucky received less than inch on average.
It was also a warm June across the Bluegrass State. After withstanding a very harsh
and cold winter, conditions have taken a 180 degree turn. Since April, every month
has seen the average temperature 2 degrees above normal. Temperatures were already
peaking in the 80s at the start of the month, but this became an understatement over
the second half of June, as the 90s were seen across a great deal of days. The
highest temperature was recorded at 94 degrees for each climate division across
Kentucky (Western, Central, Bluegrass, and Eastern). Accompanying the heat was the
one missing ingredient to really give a feel of summer here in the Lower Ohio Valley;
humidity. Dewpoints rose into the upper 60s to mid-70s on multiple occasions, which
just helped in sending the heat index into the triple digits at times. This pushed
the livestock heat stress index into the danger category each afternoon and evening.
Some locations, especially across Western Kentucky, saw the emergency category over
the last week of the month.
Temperatures for the period averaged 74 degrees across the state which was 2 degrees
warmer than normal. High temperatures averaged from 84 in the West to 83 in the East.
Departure from normal high temperatures ranged from 2 degrees cooler than normal in
the West to near normal in the East. Low temperatures averaged from 67
degrees in the West to 63 degrees in the East. Departure from normal low temperature
ranged from 4 degrees warmer than normal in the West to 4 degrees warmer than normal
in the East. The extreme high temperature for the period was 94 at BOWLING GREEN APT
and the extreme low was 44 at CYNTHIANA 8N.
Precipitation (liq. equ.) for the period totaled 3.58 inches statewide which was 0.84
inches below normal and 81% of normal. Precipitation totals by climate division, West
4.86 inches, Central 2.65 inches, Bluegrass 3.63 inches and East 3.20 inches, which
was 0.55, -1.78, -0.80 and -1.30 inches respectively from normal. By station,
precipitation totals ranged from a low of 1.10 inches at BOWLING GREEN 5S to a high
of 9.99 inches at MAYFIELD 6SW.
* = Based on preliminary data
Summarized and averaged data for the period 20140601 to 20140630(Last 30 Days)
(Not for Legal purposes. Departure from Norms based on climate divisional Averages)
AIR TEMPERATURE PRECIPITATION ExtremeTemp
STATION MAX DEV MIN DEV AVR DEV TOTAL DEV %NORM HI LO
--------------------------------------------------------------------------------
WEST(CD1) 84 -2 67 4 76 2 4.86 0.55 113 94 48
CENTRAL(CD2) 84 0 65 3 75 2 2.65 -1.78 60 94 46
BLUEGRASS(CD3) 83 0 64 3 73 1 3.63 -0.80 82 94 44
EAST(CD4) 83 0 63 4 73 2 3.20 -1.30 71 94 47
--------------------------------------------------------------------------------
STATE 84 0 65 4 74 2 3.58 -0.84 81 94 44
===
Kentucky Climate Summary
For the Period: May 2014
Above Normal Temperatures and Much Below Normal Precipitation: *
After a very wet April, an unseasonable dry and warm pattern setup across the Lower
Ohio Valley for the month of May. This year, the state averaged only 3.32 inches for
the month, which is nearly 1.5 below normal. On an average year, Kentucky sees over 5
inches of rainfall throughout May, which is typically the wettest month of the year.
This significant lull in precipitation caused the 2nd highest below normal deviation
over the past year. In doing so, extreme southeastern portions of the state are now
beginning to show abnormally dry conditions according to the latest US Drought
Monitor.
May started off very quiet with the first weekend of the month yielding to mostly
sunny skies and warmer temperatures, more typical of early summer. Temperatures were
well above normal in some locations, especially Paducah that got to a high of 88.
The weather pattern really didn't become very active until the mid-section of
the month. The most significant round came as an upper level low moved into the Ohio
Valley from the 14th to the 16th. Multiple disturbances rotated around this feature,
sparking numerous rounds of showers and storms. Some severe weather accompanied the
widespread rainfall with multiple reports of flooding and hail around 1 inch in
diameter. An EF2 tornado was even confirmed in Christian County with estimated peak
winds of 125 mph. Another event on May 22nd produced some damaging winds. The picture
below was taken from a storm survey performed by the National Weather Service in
Louisville, where a grain silo was damaged on the northwest side of Campbellsville.
Estimated peak winds were 70 to 75 mph.
 Following the passage of the upper level low, unseasonably cooler temperatures led to
a late-season patchy frost event on the nights of the 16th and 17th. Lows dipped
into the upper 30s to low 40s for much of the state. Saying this, some low lying and
sheltered locations dropped into the mid 30s, introducing a late-season patchy frost
into the picture. This event occurred at a time when much of Kentucky had less than
a 10% chance of seeing another 36 degree reading based on the past 30 years of data.
The extreme low for the 2 day period was recorded at Paintsville where a reading of
33 degrees was recorded.
A summer-like trend then ensued over the last 2 weeks of the month. A moist and
unstable air mass led to a large number of days where scattered thunderstorms
developed during the afternoon and evening hours. Localized heavy rainfall was the
main threat with any of the slow-moving cells. The sporadic nature of the storms led
to many locations staying dry throughout the last couple weeks. The driest period
came the last week of May when the Commonwealth only averaged just over a third of an
inch, which was the 4th driest week of 2014 thus far. Temperatures and humidity also
rose significantly. The last week of the month saw temperatures rise into the 80s
over nearly the entire week with some locations even staying in the 70s at night.
After going the entire winter with near to below normal temperatures, the tide has
turned through April and May with both months, 2 degrees above normal.
The warm and dry month of May allowed many farmers to make great headway in planting.
As of the end of May, the USDA Kentucky Field Office reported 94% and 52% of corn and
soybeans in the ground, respectively. Looking at soybeans, this was well ahead of
last year's percentage at this time of 28%. The majority of the Commonwealth
accumulated around 500 to 600 Growing Degree Day's over the course of
the month.
Temperatures for the period averaged 66 degrees across the state which was 2 degrees
warmer than normal. High temperatures averaged from 78 in the West to 77 in the
East. Departure from normal high temperatures ranged from near normal in
the West to 1 degree warmer than normal in the East. Low temperatures averaged
from 58 degrees in the West to 54 degrees in the East. Departure from normal low
temperature ranged from 3 degrees warmer than normal in the West to 5 degrees warmer
than normal in the East. The extreme high temperature for the period was 90 at
LOUISA 1S and the extreme low was 33 at PAINTSVILLE 4W.
Precipitation (liq. equ.) for the period totaled 3.32 inches statewide which was 1.44
inches below normal and 70% of normal. Precipitation totals by climate division, West
3.32 inches, Central 4.12 inches, Bluegrass 3.47 inches and East 2.37 inches, which
was 1.61, 0.85, 1.03 and 2.28 inches below normal. By station, precipitation totals
ranged from a low of 0.96 inches at ALBANY 1N to a high of 8.55 inches at FORT KNOX.
* = Based on preliminary data
Summarized and averaged data for the period 20140501 to 20140530(Last 30 Days)
(Not for Legal purposes. Departure from Norms based on climate divisional Averages)
AIR TEMPERATURE PRECIPITATION ExtremeTemp
STATION MAX DEV MIN DEV AVR DEV TOTAL DEV %NORM HI LO
--------------------------------------------------------------------------------
WEST(CD1) 78 0 58 3 68 2 3.32 -1.61 67 90 38
CENTRAL(CD2) 77 1 56 3 66 1 4.12 -0.85 83 89 35
BLUEGRASS(CD3) 75 0 55 3 65 2 3.47 -1.03 77 88 34
EAST(CD4) 77 1 54 5 66 3 2.37 -2.28 51 90 33
--------------------------------------------------------------------------------
STATE 77 1 56 4 66 2 3.32 -1.44 70 90 33
===
Kentucky Climate Summary
For the Period: April 2014
Above Normal Temperatures and Much Above Normal Precipitation: *
April is usually seen as a month of transition with a mix of warm and cool
temperatures, along with an upswing in precipitation. It was no different this year
and it had a direct impact on agriculture. After going six straight months of near to
below normal temperatures, the Commonwealth finally got some relief throughout April.
Over the course of the month, high temperatures got into the low to mid 80s at some
point each week. These highs are normally not seen until the end of May and into
early June. Over the course of April, the Bluegrass State was on average two degrees
above normal. While this may seem insignificant, the data has to be drawn back to
June of 2013 to find another monthly average temperature that was two degrees above
normal.
After a relatively cool March, soil temperatures increased into the upper-50s to mid-
60s as the planting season took off in full swing. Fruit trees went into full bloom
and winter wheat slowly progressed. As this was occurring, the Bluegrass State did
hit a snag over the month's mid-section. A strong cold front pushed through the area
with breezy northwest flow pushing temperatures down into the mid to upper 20s at
time. Some low lying and sheltered locations even got into the low 20s. This hard
freeze devastated much of the fruit crop. The USDA's Kentucky Weekly Crop and Weather
Report reported 58% and 61% freeze damage to the apple and peach crops, respectively.
Accompanying the cooler temperatures was even a late season snow event. One inch was
recorded at the National Weather Service in Jackson. According to the office, this
resulted in the longest snow season on record with a total of 174 days.
It was also an extremely wet month across the Commonwealth. Most of the precipitation
fell over the opening and close of April. The first round saw a state average of 2.19
inches as a series of disturbances pummeled the state. Some portions of Western
Kentucky and North Central Kentucky even saw in excess of 4 to 6 inches. This delayed
planting progress, but the following 2 weeks allowed a chance to dry out, with 32% of
corn in the ground by April 27th. Just as planting started ramping up, Mother Nature
had other plans. A second round of soaking rainfall struck over the period of April
28th through the 30th. This came as an upper level low pressure system slowly swung
northeast across the Ohio Valley. This system produced a state average of 2.62
inches, which was the most over a one week period since early December 2011. Overall,
the state of Kentucky saw an average of 6.60 inches of rainfall over the course of
the month. This ended up being the 9th wettest April on record going back to 1895.
Temperatures for the period averaged 58 degrees across the state which was 2 degrees
warmer than normal. High temperatures averaged from 70 in the West to 71 in the
East. Departure from normal high temperatures ranged from 1 degree warmer than
normal in the West to 3 degrees warmer than normal in the East. Low temperatures
averaged from 48 degrees in the West to 47 degrees in the East. Departure from
normal low temperature ranged from 2 degrees warmer than normal in the West to 7
degrees warmer than normal in the East. The extreme high temperature for the period
was 87 at LOUISA 1S and the extreme low was 21 at PIKEVILLE 13S.
Precipitation (liq. equ.) for the period totaled 6.60 inches statewide which was 2.26
inches above normal and 152% of normal. Precipitation totals by climate division,
West 7.65 inches, Central 6.93 inches, Bluegrass 6.80 inches and East 5.02 inches,
which was 2.73, 2.5, 2.84 and 0.97 inches above normal. By station, precipitation
totals ranged from a low of 2.53 inches at PIKEVILLE 13S to a high of 11.81
inches at MORGANFIELD 4E.
* = Based on preliminary data
Summarized and averaged data for the period 20140401 to 20140430(Last 30 Days)
(Not for Legal purposes. Departure from Norms based on climate divisional Averages)
AIR TEMPERATURE PRECIPITATION ExtremeTemp
STATION MAX DEV MIN DEV AVR DEV TOTAL DEV %NORM HI LO
--------------------------------------------------------------------------------
WEST(CD1) 70 1 48 2 59 1 7.65 2.73 155 84 27
CENTRAL(CD2) 70 2 48 4 59 3 6.93 2.50 156 85 25
BLUEGRASS(CD3) 68 2 47 5 57 3 6.80 2.84 172 85 22
EAST(CD4) 71 3 47 7 59 5 5.02 0.97 124 87 21
--------------------------------------------------------------------------------
STATE 70 2 48 5 58 2 6.60 2.26 152 87 21
===
Kentucky Climate Summary
For the Period: March 2014
Below Normal Temperatures and Precipitation: *
After a very cool and snowy winter, March was met with the anticipation that the tide
would finally turn. In some ways it did, but for the most part, it was another sub-
par March across the Commonwealth. The month started off just like the past few, in
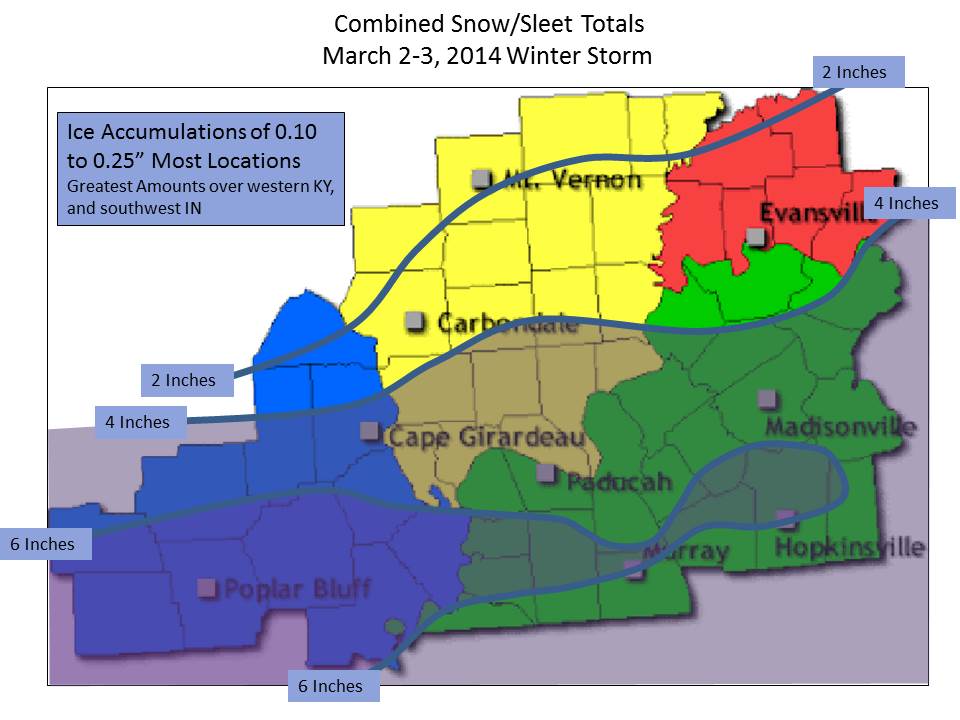
which Kentucky saw a major winter weather event. An Arctic cold front diving through
the area worked in combination with multiple upper level disturbances to produce a
mixed bag of freezing rain, sleet, and snow across the state. Road conditions
tapered with a tenth to quarter inch of ice accumulation, up to 2 inches of sleet,
and 2 to 4 inches of snow. This left a significant snowpack across the region, which
just aided in pushing temperatures lower as Arctic high pressure moved into the
Commonwealth. Highs only got into the 20s with lows dipping into the single digits
at times. Paintsville even saw a low of -2.
Going into the month's midsection, many were questioning whether spring could
actually be in sight? Southwesterly flow bumped temperatures into the 60s and 70s for
multiple times throughout the week. That period ended up being only the 3rd week this
year, where average temperatures were actually above normal. Unfortunately, cooler
air moved back into the area on the 16th. This brought another round of sleet and
snow to the area, but this time, accumulations were minimal for much of the state.
The only exception was in northeastern portions of the Bluegrass, where the area saw
3 to 5 inches.
Conditions then dried out going into the 3rd week of the month with high pressure
being the dominant factor. This period ended up being the driest week of 2014 with a
state average of only 0.09 inches of precipitation. The break was short-lived as
activity ramped back up heading into the end of March. A couple upper level
disturbances passed through on the 24th and 25th. Temperatures were sufficiently
cool and allowed for yet another late-season snow event. The second round was
accompanied by gusty winds and resulted in poor visibilities at times. Temperatures
then proceeded to warm throughout the week, but precipitation stuck around. A cold
front sparked an initial round of widespread rainfall on the 27th. This boundary then
stalled across the region the next day, with low pressure overriding the front.
Activity carried into Saturday and amounted to rainfall accumulations in excess of an
inch for the 3 day period. Saying this, precipitation was still below normal for the
month of March by three quarters of an inch.
Temperatures for the period averaged 42 degrees across the state which was 4 degrees
cooler than normal. High temperatures averaged from 54 in the West to 54 in the
East. Departure from normal high temperatures ranged from 6 degrees cooler than
normal in the West to 5 degrees cooler than normal in the East. Low temperatures
averaged from 33 degrees in the West to 32 degrees in the East. Departure from
normal low temperature ranged from 4 degrees cooler than normal in the West to 1
degree cooler than normal in the East. The extreme high temperature for the period
was 78 at PEABODY and the extreme low was -2 at PAINTSVILLE 4W.
Precipitation (liq. equ.) for the period totaled 3.70 inches statewide which was 0.75
inches below normal and 83% of normal. Precipitation totals by climate division, West
4.06 inches, Central 3.63 inches, Bluegrass 2.80 inches and East 4.30 inches, which
was 0.68, 1.06, 1.22 and 0.05 inches below normal. By station, precipitation totals
ranged from a low of 2.05 inches at TRIANGLE MOUNTAIN to a high of 5.68 inches at
JACKSON 3SE.
* = Based on preliminary data
Summarized and averaged data for the period 20140301 to 20140331(Last 31 Days)
(Not for Legal purposes. Departure from Norms based on climate divisional Averages)
AIR TEMPERATURE PRECIPITATION ExtremeTemp
STATION MAX DEV MIN DEV AVR DEV TOTAL DEV %NORM HI LO
--------------------------------------------------------------------------------
WEST(CD1) 54 -6 33 -4 43 -5 4.06 -0.68 86 77 5
CENTRAL(CD2) 54 -4 32 -4 43 -4 3.63 -1.06 77 77 7
BLUEGRASS(CD3) 52 -4 30 -4 41 -4 2.80 -1.22 70 76 1
EAST(CD4) 54 -5 32 -1 43 -3 4.30 -0.05 99 78 -2
--------------------------------------------------------------------------------
STATE 54 -4 32 -3 42 -4 3.70 -0.75 83 78 -2
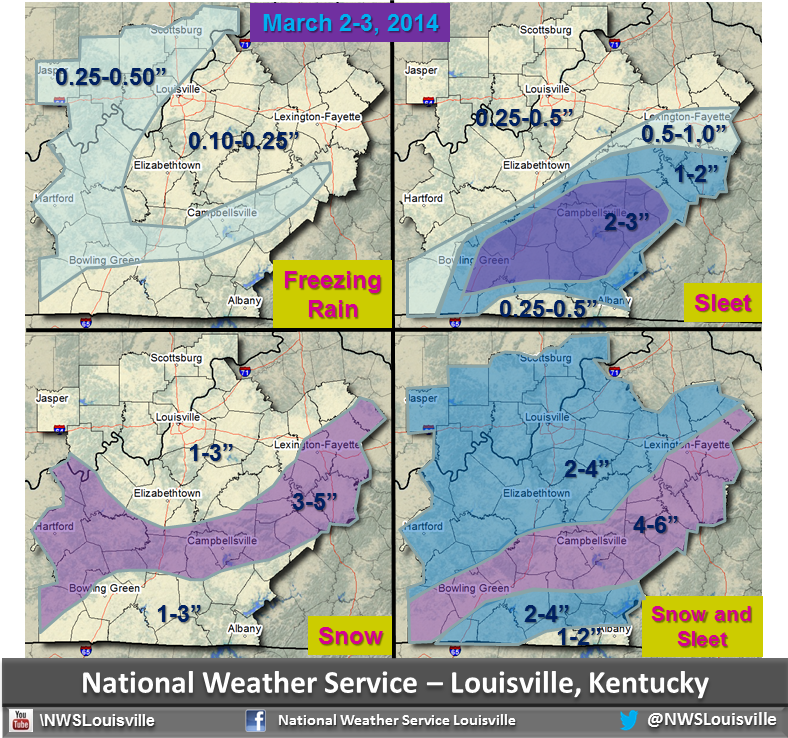
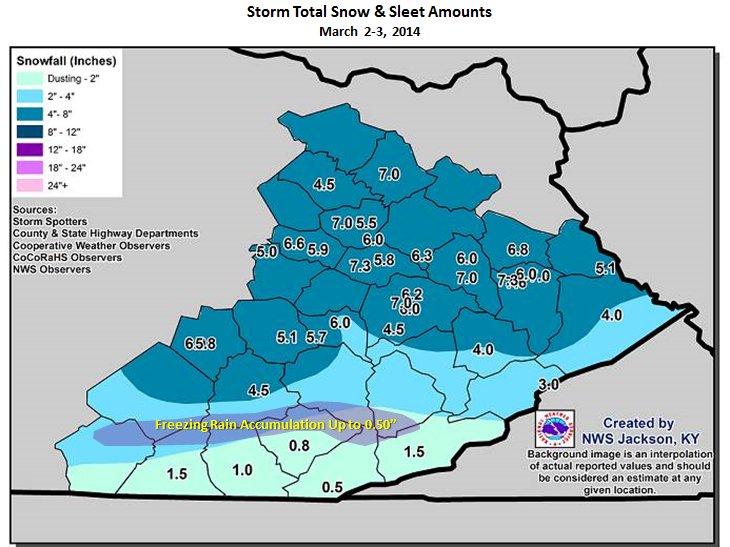
The images below, provided by the NWS office's of Paducah, Louisville, and Jackson
show the precipitation estimates across each region of the state for the winter
storm of March 2-3.
===
Kentucky Climate Summary
For the Period: February 2014
Below Normal Temperatures and Above Normal Precipitation: *
The Commonwealth just couldn't shake the cold temperatures from January, as the
extremely cold winter of 2014 continued in February. Temperatures remained below
normal for much of the month with an average statewide temperature of 34 degrees.
The first week of February set the tone for the remainder of the period with highs
generally staying in the upper 20s to low 30s. This was around 15 degrees below
normal for that time of the year. Cold, Arctic high pressure then made another
appearance over the month's mid- section. Lows pushed into the single digits once
again, with some locations going subzero. The most significant was in Vanceburg,
Kentucky that got down to a low of -4. The final week then ended with highs
generally in the 30s and 40s, but even these temperatures were well below normal.
Normal highs at the end of February are supposed to be around 50 degrees. The cool
temperatures pushed the state to a 4th straight month of near or below normal
temperatures.
The only real relief to the cold weather was over the 3rd week of the month. A
warming trend ensued ahead of a strong cold front. Breezy southwesterly flow
eventually put highs all the way into the low 70s. While the Bluegrass State did
finally see some warm temperatures, it was followed by the first major severe weather
event of the year. A deepening surface low lifted out of the Southern Plains and into
the Midwest, where it eventually dragged a very strong cold front through the region.
Numerous severe thunderstorms were sparked ahead and along the boundary with damaging
winds as the primary threat. A couple of weak tornados were also confirmed in Webster
and Caldwell counties.
The active winter weather pattern also continued into the month of February. The most
significant system occurred on Groundhog Day where much of the northern half of
Kentucky was under a Winter Weather Advisory or Winter Storm Warning. Snow blanketed
most of the region with the highest totals coming across central Kentucky and into
the Bluegrass, where some saw 5 to 7 inches. Louisville set a daily record with a
total of 3.1 inches. This was followed by another ice event with accumulations around
a quarter to half inch in western and the northern half of Kentucky (Figure 1 - NWS
Paducah). A winter storm then passed south of the Bluegrass State on the 12th and
13th, which eventually brought accumulating snow to southeastern portions of the
area. Some of the high elevations received in excess of 10 inches. This is shown in
Figure 2 below, which was put together by the National Weather Service in Jackson.
Over the course of the month, Lexington saw over 8 inches of snowfall, which was
about 4 inches above normal. The state ended the month with an average liquid
equivalent of 4.53 inches, which was 0.61 inches above normal.
Temperatures for the period averaged 34 degrees across the state which was 4 degrees
cooler than normal and 6 degrees warmer than the previous period. High temperatures
averaged from 42 in the West to 45 in the East. Departure from normal high
temperatures ranged from 7 degrees cooler than normal in the West to 4 degrees cooler
than normal in the East. Low temperatures averaged from 26 degrees in the West to 27
degrees in the East. Departure from normal low temperature ranged from 3 degrees
cooler than normal in the West to 1 degree warmer than normal in the East. The
extreme high temperature for the period was 75 degrees at BOWLING GREEN APT and the
extreme low was -4 degrees at VANCEBURG 6W.
Precipitation (liq. equ.) for the period totaled 4.53 inches statewide which was 0.61
inches above normal and 115% of normal. Precipitation totals by climate division,
West 4.15 inches, Central 5.06 inches, Bluegrass 4.36 inches and East 4.55 inches,
which was -0.21, 0.81, 0.96 and 0.86 inches respectively from normal. By station,
precipitation totals ranged from a low of 2.41 inches at MORGANFIELD 4E to a high of
6.67 inches at BOWLING GREEN 4E.
* = Based on preliminary data
Summarized and averaged data for the period 20140201 to 20140228(Last 30 Days)
(Not for Legal purposes. Departure from Norms based on climate divisional Averages)
AIR TEMPERATURE PRECIPITATION ExtremeTemp
STATION MAX DEV MIN DEV AVR DEV TOTAL DEV %NORM HI LO
--------------------------------------------------------------------------------
WEST(CD1) 42 -7 26 -3 34 -5 4.15 -0.21 95 72 0
CENTRAL(CD2) 43 -5 26 -2 34 -4 5.06 0.81 119 75 0
BLUEGRASS(CD3) 39 -7 24 -2 32 -4 4.36 0.96 128 70 -2
EAST(CD4) 45 -4 27 1 36 -1 4.55 0.86 123 74 -4
--------------------------------------------------------------------------------
STATE 42 -6 26 -1 34 -4 4.53 0.61 115 75 -4
===
Kentucky Climate Summary
For the Period: January 2014
Near Normal Temperatures and Above Normal Precipitation: *
Frigid conditions left much of the Commonwealth in a deep freeze through the month of
January. On multiple occasions, Arctic air pushed into the state and sent
temperatures well below zero. Over the course of the month, low temperatures only
averaged 18 degrees across the state, which is 6 degrees below normal. The National
Weather Service in Louisville reports that this was the coldest January since 2003
for the cities of Lexington and Louisville. In addition, the state average
temperature of 28 degrees was the 13th coldest on record going back to 1895. Saying
this, it was still nowhere near the record set back in 1977 when the area averaged a
temperature of 18 degrees. Overall, this cool trend has led to 4 of the first 5 weeks
of 2014 seeing below normal temperatures.
The first round of dangerously cold temperatures came on January 6th. Highs only got
into the single digits before dropping well below zero that night. Temperatures
mostly ranged between 0 and -10 across much of the state, which was the coldest
widespread temperatures witnessed since January of 2011. Saying this, Pikeville did
get down to a low of -13. Breezy northwesterly flow pushed the wind chill down to
below -20 at times. The most prolonged cold-spell came over the third week of the
month. The state’s average minimum temperature over the course of the week was only
13 degrees. This week featured another Arctic blast with temperatures falling well
below normal at times. This time around, the Richmond Mesonet Station recorded a low
of -15 degrees.
As it can be seen with very cold temperatures, most of the precipitation falling
across the state was in the form of snow. The brunt of the powder came throughout the
Bluegrass Region where areas saw in excess of 8 inches. The 8.6 that Lexington saw
over the course of January was over 4 inches above normal. Most of the time, each
system that moved through the area put another 1 to 2 inches on ground. The only
exception came through the third week of the month, when an Alberta Clipper traveling
southeast into the area on the 21st laid 3 to 6 inches on the ground.
Temperatures for the period averaged 28 degrees across the state which was 5 degrees
cooler than normal. High temperatures averaged from 40 in the West to 39 in the East.
Departure from normal high temperatures ranged from 3 degrees cooler than normal in
the West to 5 degrees cooler than normal in the East. Low temperatures averaged from
20 degrees in the West to 18 degrees in the East. Departure from normal low
temperature ranged from 5 degrees cooler than normal in the West to 5 degrees cooler
than normal in the East. The extreme high temperature for the period was 62 at BENTON
4N and the extreme low was -15 at RICHMOND 8E.
Precipitation (liq. equ.) for the period totaled 2.23 inches statewide which was 1.5
inches below normal and 60% of normal. Precipitation totals by climate division, West
2.00 inches, Central 2.29 inches, Bluegrass 2.19 inches and East 2.44 inches, which
was 1.93, 1.7, 1.03 and 1.35 inches below normal. By station, precipitation totals
ranged from a low of 1.17 inches at BIG SANDY to a high of 3.44 inches at ALBANY 1N.
* = Based on preliminary data
Summarized and averaged data for the period 20140101 to 20140131(Last 31 Days)
(Not for Legal purposes. Departure from Norms based on climate divisional Averages)
AIR TEMPERATURE PRECIPITATION ExtremeTemp
STATION MAX DEV MIN DEV AVR DEV TOTAL DEV %NORM HI LO
--------------------------------------------------------------------------------
WEST(CD1) 40 -3 20 -5 30 -4 2.00 -1.93 51 62 -5
CENTRAL(CD2) 39 -3 19 -6 29 -4 2.29 -1.70 57 61 -6
BLUEGRASS(CD3) 36 -5 17 -6 26 -6 2.19 -1.03 68 58 -15
EAST(CD4) 39 -5 18 -5 28 -5 2.44 -1.35 64 62 -14
--------------------------------------------------------------------------------
STATE 38 -4 18 -6 28 -5 2.23 -1.50 60 62 -15
===
Following the passage of the upper level low, unseasonably cooler temperatures led to
a late-season patchy frost event on the nights of the 16th and 17th. Lows dipped
into the upper 30s to low 40s for much of the state. Saying this, some low lying and
sheltered locations dropped into the mid 30s, introducing a late-season patchy frost
into the picture. This event occurred at a time when much of Kentucky had less than
a 10% chance of seeing another 36 degree reading based on the past 30 years of data.
The extreme low for the 2 day period was recorded at Paintsville where a reading of
33 degrees was recorded.
A summer-like trend then ensued over the last 2 weeks of the month. A moist and
unstable air mass led to a large number of days where scattered thunderstorms
developed during the afternoon and evening hours. Localized heavy rainfall was the
main threat with any of the slow-moving cells. The sporadic nature of the storms led
to many locations staying dry throughout the last couple weeks. The driest period
came the last week of May when the Commonwealth only averaged just over a third of an
inch, which was the 4th driest week of 2014 thus far. Temperatures and humidity also
rose significantly. The last week of the month saw temperatures rise into the 80s
over nearly the entire week with some locations even staying in the 70s at night.
After going the entire winter with near to below normal temperatures, the tide has
turned through April and May with both months, 2 degrees above normal.
The warm and dry month of May allowed many farmers to make great headway in planting.
As of the end of May, the USDA Kentucky Field Office reported 94% and 52% of corn and
soybeans in the ground, respectively. Looking at soybeans, this was well ahead of
last year's percentage at this time of 28%. The majority of the Commonwealth
accumulated around 500 to 600 Growing Degree Day's over the course of
the month.
Temperatures for the period averaged 66 degrees across the state which was 2 degrees
warmer than normal. High temperatures averaged from 78 in the West to 77 in the
East. Departure from normal high temperatures ranged from near normal in
the West to 1 degree warmer than normal in the East. Low temperatures averaged
from 58 degrees in the West to 54 degrees in the East. Departure from normal low
temperature ranged from 3 degrees warmer than normal in the West to 5 degrees warmer
than normal in the East. The extreme high temperature for the period was 90 at
LOUISA 1S and the extreme low was 33 at PAINTSVILLE 4W.
Precipitation (liq. equ.) for the period totaled 3.32 inches statewide which was 1.44
inches below normal and 70% of normal. Precipitation totals by climate division, West
3.32 inches, Central 4.12 inches, Bluegrass 3.47 inches and East 2.37 inches, which
was 1.61, 0.85, 1.03 and 2.28 inches below normal. By station, precipitation totals
ranged from a low of 0.96 inches at ALBANY 1N to a high of 8.55 inches at FORT KNOX.
* = Based on preliminary data
Summarized and averaged data for the period 20140501 to 20140530(Last 30 Days)
(Not for Legal purposes. Departure from Norms based on climate divisional Averages)
AIR TEMPERATURE PRECIPITATION ExtremeTemp
STATION MAX DEV MIN DEV AVR DEV TOTAL DEV %NORM HI LO
--------------------------------------------------------------------------------
WEST(CD1) 78 0 58 3 68 2 3.32 -1.61 67 90 38
CENTRAL(CD2) 77 1 56 3 66 1 4.12 -0.85 83 89 35
BLUEGRASS(CD3) 75 0 55 3 65 2 3.47 -1.03 77 88 34
EAST(CD4) 77 1 54 5 66 3 2.37 -2.28 51 90 33
--------------------------------------------------------------------------------
STATE 77 1 56 4 66 2 3.32 -1.44 70 90 33
===
Kentucky Climate Summary
For the Period: April 2014
Above Normal Temperatures and Much Above Normal Precipitation: *
April is usually seen as a month of transition with a mix of warm and cool
temperatures, along with an upswing in precipitation. It was no different this year
and it had a direct impact on agriculture. After going six straight months of near to
below normal temperatures, the Commonwealth finally got some relief throughout April.
Over the course of the month, high temperatures got into the low to mid 80s at some
point each week. These highs are normally not seen until the end of May and into
early June. Over the course of April, the Bluegrass State was on average two degrees
above normal. While this may seem insignificant, the data has to be drawn back to
June of 2013 to find another monthly average temperature that was two degrees above
normal.
After a relatively cool March, soil temperatures increased into the upper-50s to mid-
60s as the planting season took off in full swing. Fruit trees went into full bloom
and winter wheat slowly progressed. As this was occurring, the Bluegrass State did
hit a snag over the month's mid-section. A strong cold front pushed through the area
with breezy northwest flow pushing temperatures down into the mid to upper 20s at
time. Some low lying and sheltered locations even got into the low 20s. This hard
freeze devastated much of the fruit crop. The USDA's Kentucky Weekly Crop and Weather
Report reported 58% and 61% freeze damage to the apple and peach crops, respectively.
Accompanying the cooler temperatures was even a late season snow event. One inch was
recorded at the National Weather Service in Jackson. According to the office, this
resulted in the longest snow season on record with a total of 174 days.
It was also an extremely wet month across the Commonwealth. Most of the precipitation
fell over the opening and close of April. The first round saw a state average of 2.19
inches as a series of disturbances pummeled the state. Some portions of Western
Kentucky and North Central Kentucky even saw in excess of 4 to 6 inches. This delayed
planting progress, but the following 2 weeks allowed a chance to dry out, with 32% of
corn in the ground by April 27th. Just as planting started ramping up, Mother Nature
had other plans. A second round of soaking rainfall struck over the period of April
28th through the 30th. This came as an upper level low pressure system slowly swung
northeast across the Ohio Valley. This system produced a state average of 2.62
inches, which was the most over a one week period since early December 2011. Overall,
the state of Kentucky saw an average of 6.60 inches of rainfall over the course of
the month. This ended up being the 9th wettest April on record going back to 1895.
Temperatures for the period averaged 58 degrees across the state which was 2 degrees
warmer than normal. High temperatures averaged from 70 in the West to 71 in the
East. Departure from normal high temperatures ranged from 1 degree warmer than
normal in the West to 3 degrees warmer than normal in the East. Low temperatures
averaged from 48 degrees in the West to 47 degrees in the East. Departure from
normal low temperature ranged from 2 degrees warmer than normal in the West to 7
degrees warmer than normal in the East. The extreme high temperature for the period
was 87 at LOUISA 1S and the extreme low was 21 at PIKEVILLE 13S.
Precipitation (liq. equ.) for the period totaled 6.60 inches statewide which was 2.26
inches above normal and 152% of normal. Precipitation totals by climate division,
West 7.65 inches, Central 6.93 inches, Bluegrass 6.80 inches and East 5.02 inches,
which was 2.73, 2.5, 2.84 and 0.97 inches above normal. By station, precipitation
totals ranged from a low of 2.53 inches at PIKEVILLE 13S to a high of 11.81
inches at MORGANFIELD 4E.
* = Based on preliminary data
Summarized and averaged data for the period 20140401 to 20140430(Last 30 Days)
(Not for Legal purposes. Departure from Norms based on climate divisional Averages)
AIR TEMPERATURE PRECIPITATION ExtremeTemp
STATION MAX DEV MIN DEV AVR DEV TOTAL DEV %NORM HI LO
--------------------------------------------------------------------------------
WEST(CD1) 70 1 48 2 59 1 7.65 2.73 155 84 27
CENTRAL(CD2) 70 2 48 4 59 3 6.93 2.50 156 85 25
BLUEGRASS(CD3) 68 2 47 5 57 3 6.80 2.84 172 85 22
EAST(CD4) 71 3 47 7 59 5 5.02 0.97 124 87 21
--------------------------------------------------------------------------------
STATE 70 2 48 5 58 2 6.60 2.26 152 87 21
===
Kentucky Climate Summary
For the Period: March 2014
Below Normal Temperatures and Precipitation: *
After a very cool and snowy winter, March was met with the anticipation that the tide
would finally turn. In some ways it did, but for the most part, it was another sub-
par March across the Commonwealth. The month started off just like the past few, in
which Kentucky saw a major winter weather event. An Arctic cold front diving through
the area worked in combination with multiple upper level disturbances to produce a
mixed bag of freezing rain, sleet, and snow across the state. Road conditions
tapered with a tenth to quarter inch of ice accumulation, up to 2 inches of sleet,
and 2 to 4 inches of snow. This left a significant snowpack across the region, which
just aided in pushing temperatures lower as Arctic high pressure moved into the
Commonwealth. Highs only got into the 20s with lows dipping into the single digits
at times. Paintsville even saw a low of -2.
Going into the month's midsection, many were questioning whether spring could
actually be in sight? Southwesterly flow bumped temperatures into the 60s and 70s for
multiple times throughout the week. That period ended up being only the 3rd week this
year, where average temperatures were actually above normal. Unfortunately, cooler
air moved back into the area on the 16th. This brought another round of sleet and
snow to the area, but this time, accumulations were minimal for much of the state.
The only exception was in northeastern portions of the Bluegrass, where the area saw
3 to 5 inches.
Conditions then dried out going into the 3rd week of the month with high pressure
being the dominant factor. This period ended up being the driest week of 2014 with a
state average of only 0.09 inches of precipitation. The break was short-lived as
activity ramped back up heading into the end of March. A couple upper level
disturbances passed through on the 24th and 25th. Temperatures were sufficiently
cool and allowed for yet another late-season snow event. The second round was
accompanied by gusty winds and resulted in poor visibilities at times. Temperatures
then proceeded to warm throughout the week, but precipitation stuck around. A cold
front sparked an initial round of widespread rainfall on the 27th. This boundary then
stalled across the region the next day, with low pressure overriding the front.
Activity carried into Saturday and amounted to rainfall accumulations in excess of an
inch for the 3 day period. Saying this, precipitation was still below normal for the
month of March by three quarters of an inch.
Temperatures for the period averaged 42 degrees across the state which was 4 degrees
cooler than normal. High temperatures averaged from 54 in the West to 54 in the
East. Departure from normal high temperatures ranged from 6 degrees cooler than
normal in the West to 5 degrees cooler than normal in the East. Low temperatures
averaged from 33 degrees in the West to 32 degrees in the East. Departure from
normal low temperature ranged from 4 degrees cooler than normal in the West to 1
degree cooler than normal in the East. The extreme high temperature for the period
was 78 at PEABODY and the extreme low was -2 at PAINTSVILLE 4W.
Precipitation (liq. equ.) for the period totaled 3.70 inches statewide which was 0.75
inches below normal and 83% of normal. Precipitation totals by climate division, West
4.06 inches, Central 3.63 inches, Bluegrass 2.80 inches and East 4.30 inches, which
was 0.68, 1.06, 1.22 and 0.05 inches below normal. By station, precipitation totals
ranged from a low of 2.05 inches at TRIANGLE MOUNTAIN to a high of 5.68 inches at
JACKSON 3SE.
* = Based on preliminary data
Summarized and averaged data for the period 20140301 to 20140331(Last 31 Days)
(Not for Legal purposes. Departure from Norms based on climate divisional Averages)
AIR TEMPERATURE PRECIPITATION ExtremeTemp
STATION MAX DEV MIN DEV AVR DEV TOTAL DEV %NORM HI LO
--------------------------------------------------------------------------------
WEST(CD1) 54 -6 33 -4 43 -5 4.06 -0.68 86 77 5
CENTRAL(CD2) 54 -4 32 -4 43 -4 3.63 -1.06 77 77 7
BLUEGRASS(CD3) 52 -4 30 -4 41 -4 2.80 -1.22 70 76 1
EAST(CD4) 54 -5 32 -1 43 -3 4.30 -0.05 99 78 -2
--------------------------------------------------------------------------------
STATE 54 -4 32 -3 42 -4 3.70 -0.75 83 78 -2
The images below, provided by the NWS office's of Paducah, Louisville, and Jackson
show the precipitation estimates across each region of the state for the winter
storm of March 2-3.
===
Kentucky Climate Summary
For the Period: February 2014
Below Normal Temperatures and Above Normal Precipitation: *
The Commonwealth just couldn't shake the cold temperatures from January, as the
extremely cold winter of 2014 continued in February. Temperatures remained below
normal for much of the month with an average statewide temperature of 34 degrees.
The first week of February set the tone for the remainder of the period with highs
generally staying in the upper 20s to low 30s. This was around 15 degrees below
normal for that time of the year. Cold, Arctic high pressure then made another
appearance over the month's mid- section. Lows pushed into the single digits once
again, with some locations going subzero. The most significant was in Vanceburg,
Kentucky that got down to a low of -4. The final week then ended with highs
generally in the 30s and 40s, but even these temperatures were well below normal.
Normal highs at the end of February are supposed to be around 50 degrees. The cool
temperatures pushed the state to a 4th straight month of near or below normal
temperatures.
The only real relief to the cold weather was over the 3rd week of the month. A
warming trend ensued ahead of a strong cold front. Breezy southwesterly flow
eventually put highs all the way into the low 70s. While the Bluegrass State did
finally see some warm temperatures, it was followed by the first major severe weather
event of the year. A deepening surface low lifted out of the Southern Plains and into
the Midwest, where it eventually dragged a very strong cold front through the region.
Numerous severe thunderstorms were sparked ahead and along the boundary with damaging
winds as the primary threat. A couple of weak tornados were also confirmed in Webster
and Caldwell counties.
The active winter weather pattern also continued into the month of February. The most
significant system occurred on Groundhog Day where much of the northern half of
Kentucky was under a Winter Weather Advisory or Winter Storm Warning. Snow blanketed
most of the region with the highest totals coming across central Kentucky and into
the Bluegrass, where some saw 5 to 7 inches. Louisville set a daily record with a
total of 3.1 inches. This was followed by another ice event with accumulations around
a quarter to half inch in western and the northern half of Kentucky (Figure 1 - NWS
Paducah). A winter storm then passed south of the Bluegrass State on the 12th and
13th, which eventually brought accumulating snow to southeastern portions of the
area. Some of the high elevations received in excess of 10 inches. This is shown in
Figure 2 below, which was put together by the National Weather Service in Jackson.
Over the course of the month, Lexington saw over 8 inches of snowfall, which was
about 4 inches above normal. The state ended the month with an average liquid
equivalent of 4.53 inches, which was 0.61 inches above normal.
Temperatures for the period averaged 34 degrees across the state which was 4 degrees
cooler than normal and 6 degrees warmer than the previous period. High temperatures
averaged from 42 in the West to 45 in the East. Departure from normal high
temperatures ranged from 7 degrees cooler than normal in the West to 4 degrees cooler
than normal in the East. Low temperatures averaged from 26 degrees in the West to 27
degrees in the East. Departure from normal low temperature ranged from 3 degrees
cooler than normal in the West to 1 degree warmer than normal in the East. The
extreme high temperature for the period was 75 degrees at BOWLING GREEN APT and the
extreme low was -4 degrees at VANCEBURG 6W.
Precipitation (liq. equ.) for the period totaled 4.53 inches statewide which was 0.61
inches above normal and 115% of normal. Precipitation totals by climate division,
West 4.15 inches, Central 5.06 inches, Bluegrass 4.36 inches and East 4.55 inches,
which was -0.21, 0.81, 0.96 and 0.86 inches respectively from normal. By station,
precipitation totals ranged from a low of 2.41 inches at MORGANFIELD 4E to a high of
6.67 inches at BOWLING GREEN 4E.
* = Based on preliminary data
Summarized and averaged data for the period 20140201 to 20140228(Last 30 Days)
(Not for Legal purposes. Departure from Norms based on climate divisional Averages)
AIR TEMPERATURE PRECIPITATION ExtremeTemp
STATION MAX DEV MIN DEV AVR DEV TOTAL DEV %NORM HI LO
--------------------------------------------------------------------------------
WEST(CD1) 42 -7 26 -3 34 -5 4.15 -0.21 95 72 0
CENTRAL(CD2) 43 -5 26 -2 34 -4 5.06 0.81 119 75 0
BLUEGRASS(CD3) 39 -7 24 -2 32 -4 4.36 0.96 128 70 -2
EAST(CD4) 45 -4 27 1 36 -1 4.55 0.86 123 74 -4
--------------------------------------------------------------------------------
STATE 42 -6 26 -1 34 -4 4.53 0.61 115 75 -4
===
Kentucky Climate Summary
For the Period: January 2014
Near Normal Temperatures and Above Normal Precipitation: *
Frigid conditions left much of the Commonwealth in a deep freeze through the month of
January. On multiple occasions, Arctic air pushed into the state and sent
temperatures well below zero. Over the course of the month, low temperatures only
averaged 18 degrees across the state, which is 6 degrees below normal. The National
Weather Service in Louisville reports that this was the coldest January since 2003
for the cities of Lexington and Louisville. In addition, the state average
temperature of 28 degrees was the 13th coldest on record going back to 1895. Saying
this, it was still nowhere near the record set back in 1977 when the area averaged a
temperature of 18 degrees. Overall, this cool trend has led to 4 of the first 5 weeks
of 2014 seeing below normal temperatures.
The first round of dangerously cold temperatures came on January 6th. Highs only got
into the single digits before dropping well below zero that night. Temperatures
mostly ranged between 0 and -10 across much of the state, which was the coldest
widespread temperatures witnessed since January of 2011. Saying this, Pikeville did
get down to a low of -13. Breezy northwesterly flow pushed the wind chill down to
below -20 at times. The most prolonged cold-spell came over the third week of the
month. The state’s average minimum temperature over the course of the week was only
13 degrees. This week featured another Arctic blast with temperatures falling well
below normal at times. This time around, the Richmond Mesonet Station recorded a low
of -15 degrees.
As it can be seen with very cold temperatures, most of the precipitation falling
across the state was in the form of snow. The brunt of the powder came throughout the
Bluegrass Region where areas saw in excess of 8 inches. The 8.6 that Lexington saw
over the course of January was over 4 inches above normal. Most of the time, each
system that moved through the area put another 1 to 2 inches on ground. The only
exception came through the third week of the month, when an Alberta Clipper traveling
southeast into the area on the 21st laid 3 to 6 inches on the ground.
Temperatures for the period averaged 28 degrees across the state which was 5 degrees
cooler than normal. High temperatures averaged from 40 in the West to 39 in the East.
Departure from normal high temperatures ranged from 3 degrees cooler than normal in
the West to 5 degrees cooler than normal in the East. Low temperatures averaged from
20 degrees in the West to 18 degrees in the East. Departure from normal low
temperature ranged from 5 degrees cooler than normal in the West to 5 degrees cooler
than normal in the East. The extreme high temperature for the period was 62 at BENTON
4N and the extreme low was -15 at RICHMOND 8E.
Precipitation (liq. equ.) for the period totaled 2.23 inches statewide which was 1.5
inches below normal and 60% of normal. Precipitation totals by climate division, West
2.00 inches, Central 2.29 inches, Bluegrass 2.19 inches and East 2.44 inches, which
was 1.93, 1.7, 1.03 and 1.35 inches below normal. By station, precipitation totals
ranged from a low of 1.17 inches at BIG SANDY to a high of 3.44 inches at ALBANY 1N.
* = Based on preliminary data
Summarized and averaged data for the period 20140101 to 20140131(Last 31 Days)
(Not for Legal purposes. Departure from Norms based on climate divisional Averages)
AIR TEMPERATURE PRECIPITATION ExtremeTemp
STATION MAX DEV MIN DEV AVR DEV TOTAL DEV %NORM HI LO
--------------------------------------------------------------------------------
WEST(CD1) 40 -3 20 -5 30 -4 2.00 -1.93 51 62 -5
CENTRAL(CD2) 39 -3 19 -6 29 -4 2.29 -1.70 57 61 -6
BLUEGRASS(CD3) 36 -5 17 -6 26 -6 2.19 -1.03 68 58 -15
EAST(CD4) 39 -5 18 -5 28 -5 2.44 -1.35 64 62 -14
--------------------------------------------------------------------------------
STATE 38 -4 18 -6 28 -5 2.23 -1.50 60 62 -15
===