APPENDIX 11
TRANSPARENCY MASTERS
The overhead transparency masters that follow have been prepared from
figures in METEOROLOGY- The Atmosphere and the Science of Weather, Third
Edition, by Joseph M. Moran and Michael D. Morgan.
Trans. No
- The
average variation of temperature with altitude within the atmosphere.
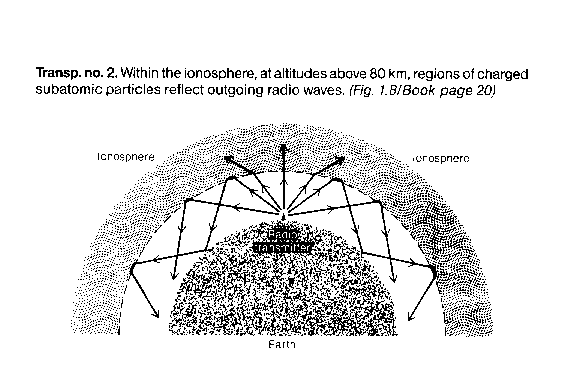
- The
ionosphere, at altitudes above 80 km, regions of charged subatomic particles
reflect outgoing radio waves.
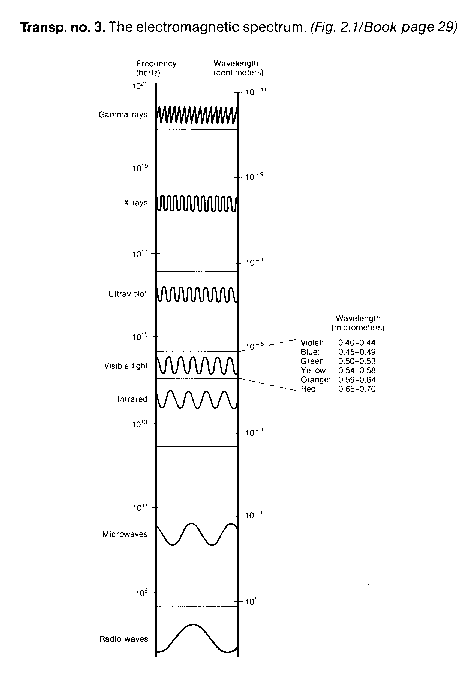
- The
electromagnetic spectrum.
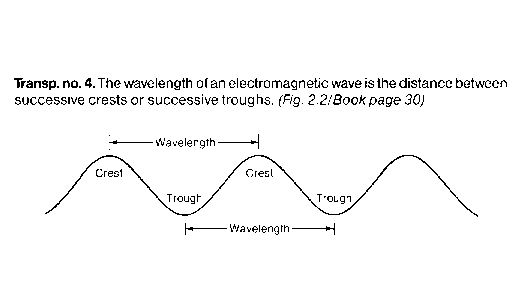
- The
wavelength of an electromagnetic wave is the distance between successive
crests or successive troughs.
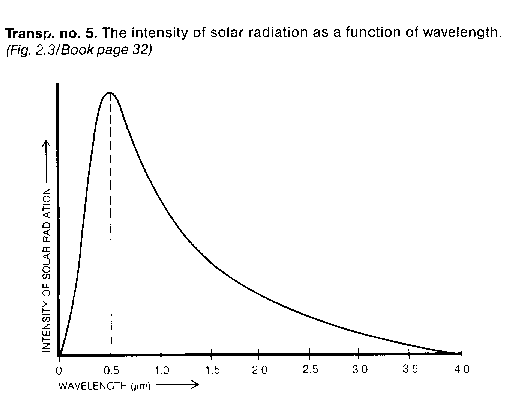
- The
intensity of solar radiation as a function of wavelength.
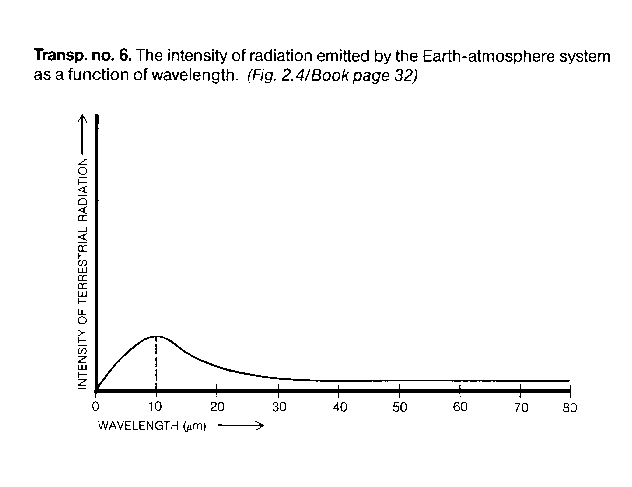
- The
intensity of radiation emitted by the Earth-atmosphere system as a function
of wavelength.
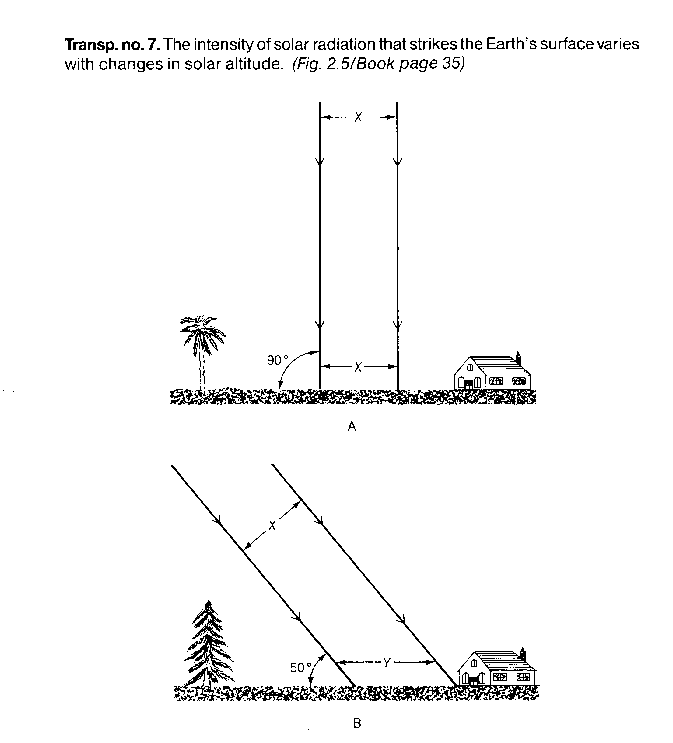
- The
intensity of solar radiation that strikes the Earth's surface varies with
changes in solar altitude.
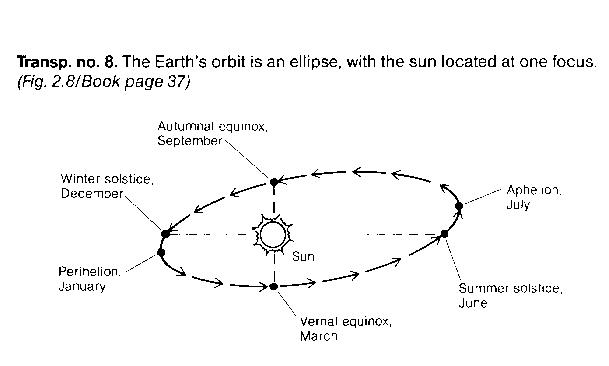
- The
Earth's orbit is an ellipse, with the sun located at one focus.
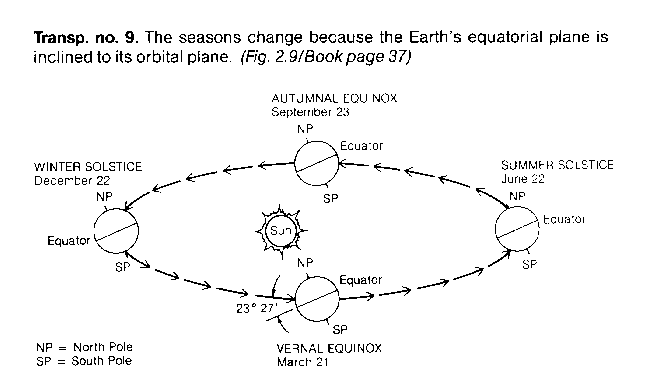
- The
seasons change because the Earth's equatorial plane is inclined to its
orbital plane.
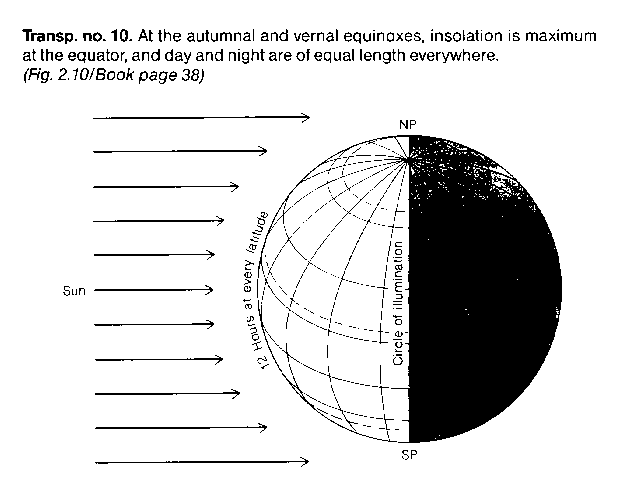
- At
the autumnal and vernal equinoxes, insolation is maximum at the equator,
and day and night are of equal length everywhere.
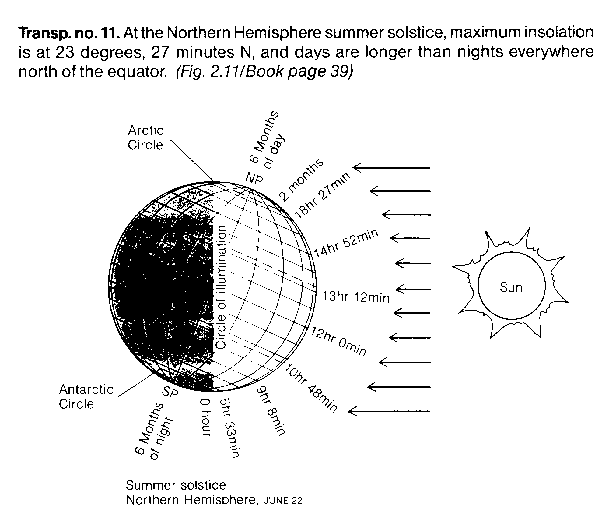
- At
the Northern Hemisphere summer solstice, maximum insolation is at 23 degrees,
27 minutes N. and days are longer than nights everywhere north of the equator.
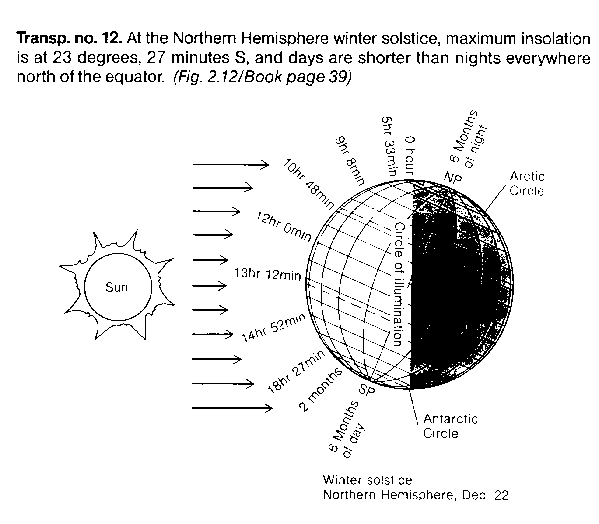
- At the Northern Hemisphere winter solstice, maximum
insolation is at 23 degrees, 27 minutes S, and days are shorter than nights
everywhere north of the equator.
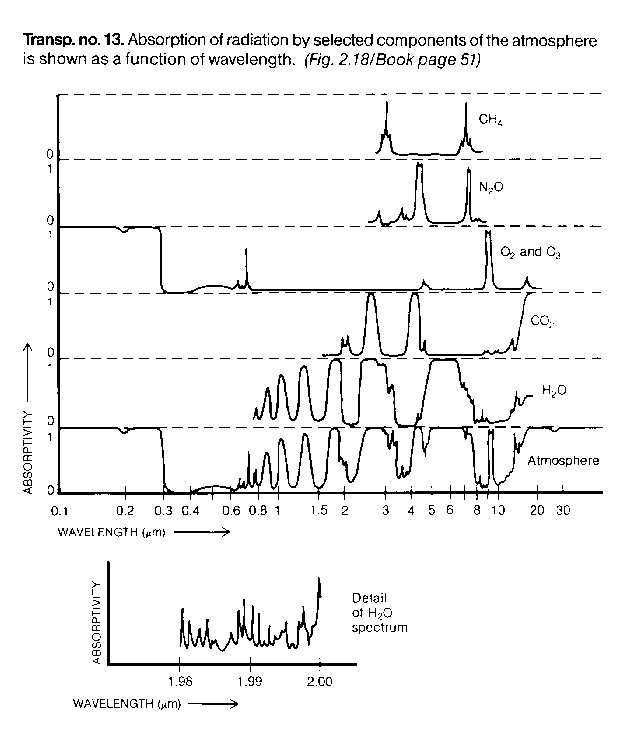
- Absorption of radiation by selected components
of the atmosphere is shown as a function of wavelength.
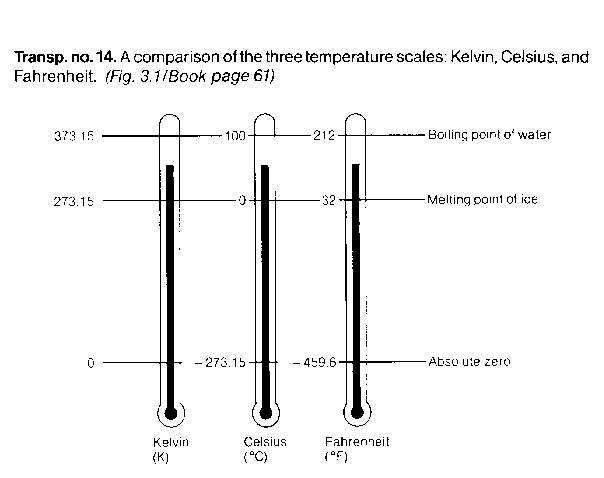
- A comparison of the three temperature scales:
Kelvin, Celsius, and Fahrenheit.
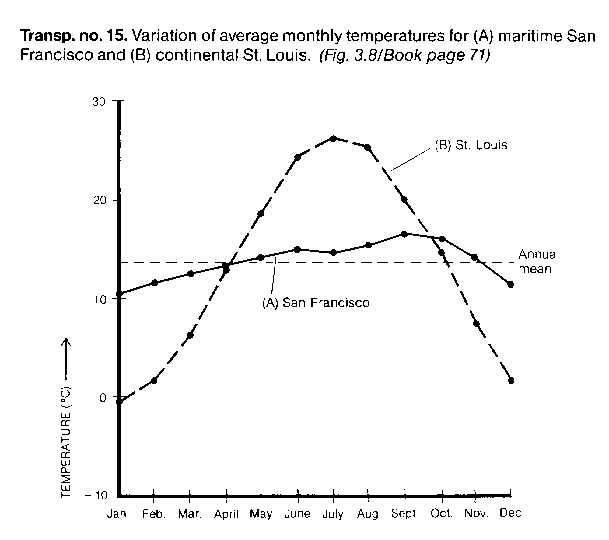
- Variation of average monthly temperatures for
(A) maritime San Francisco and (B) continental St. Louis.
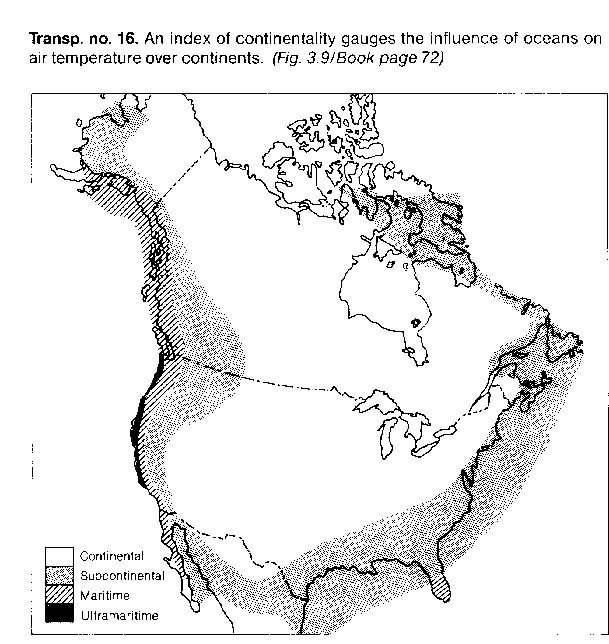
- An index of continentality gauges the influence
of oceans on air temperature over continents.
- Average annual heating degree-day totals over
lower 48 states.
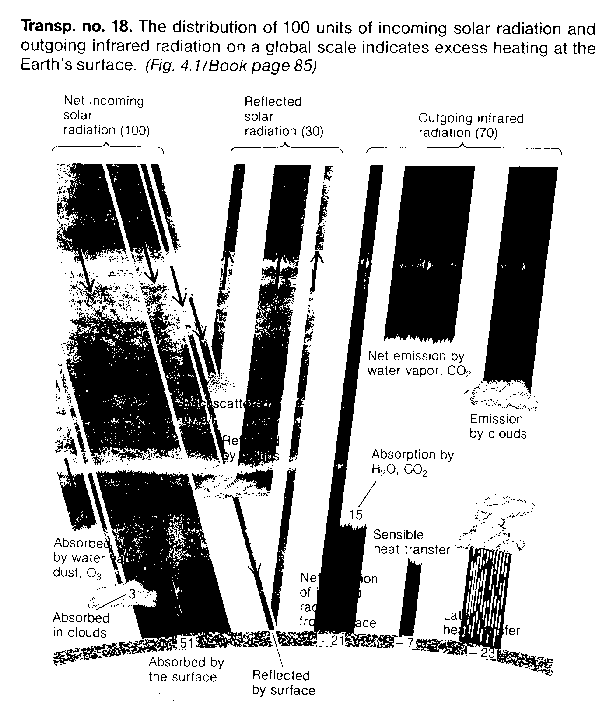
- The distribution of 100 units of incoming solar
radiation and outgoing, infrared radiation on a global scale indicates
excess heating at the Earth's surface.
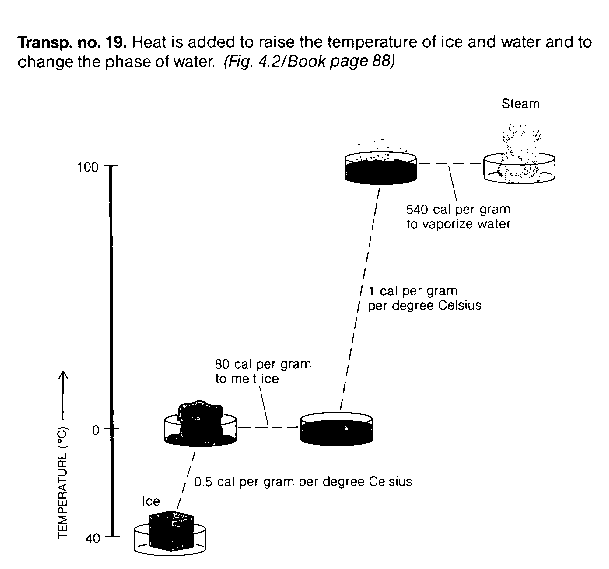
- Heat is added to raise the temperature of ice
and water and to change the phase of water.
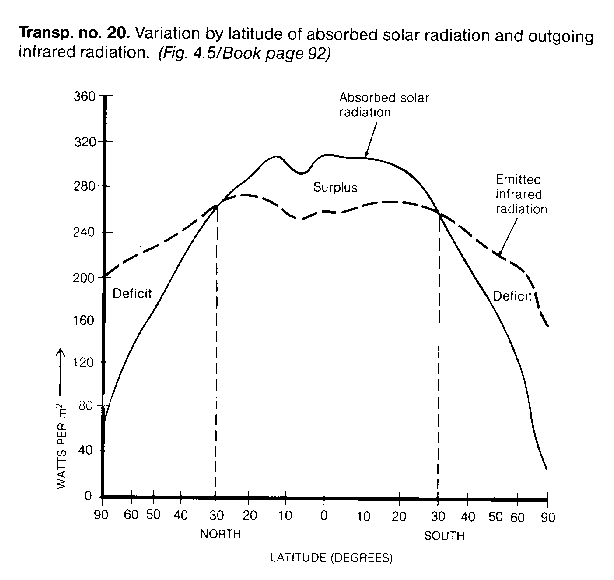
- Variation by latitude of absorbed solar radiation
and outgoing infrared radiation.
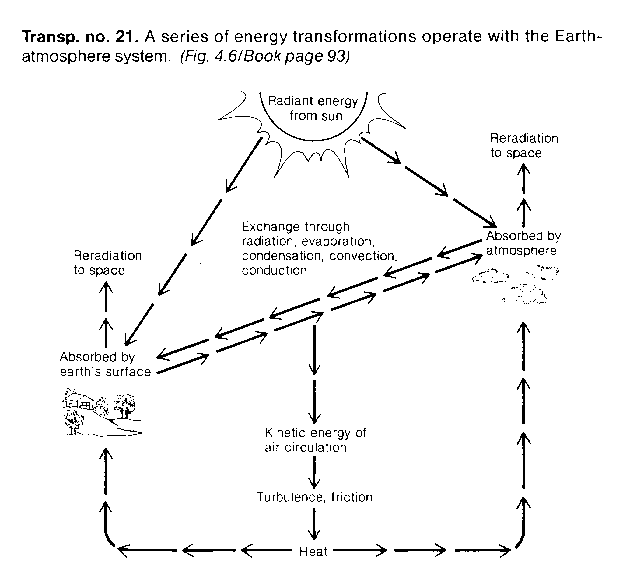
- A series of energy transformations operate with
the Earth-atmosphere system.
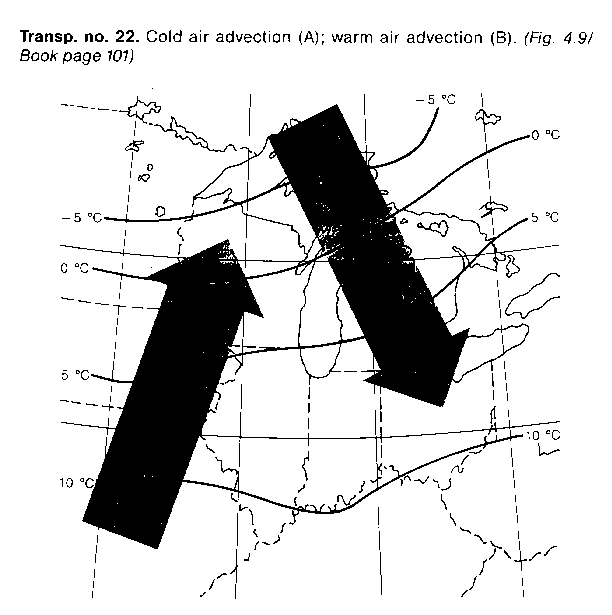
- Cold air advention (A); warm air advection (B).
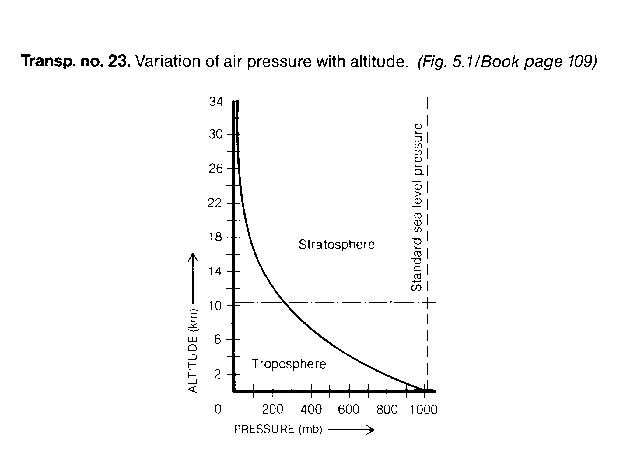
- Variation of air pressure with altitude.
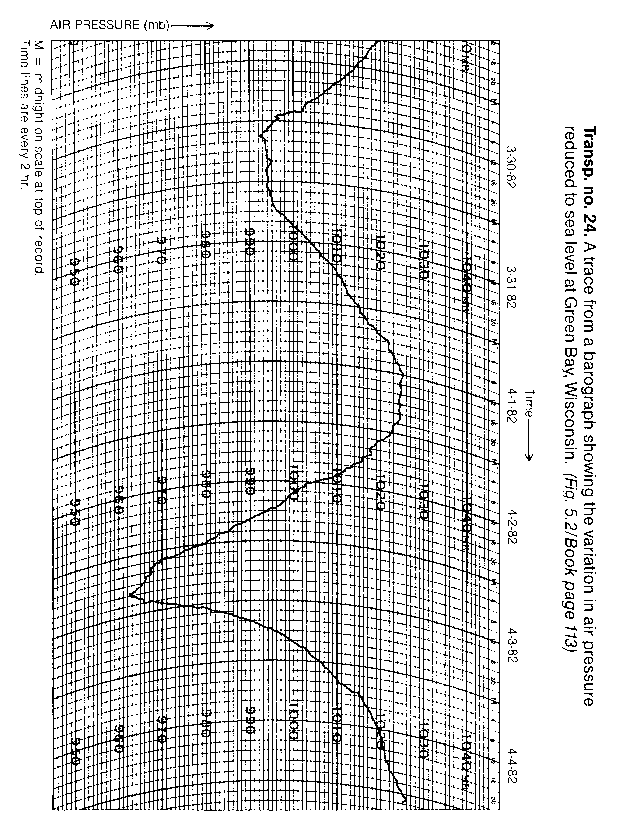
- A trace from a barograph showing the variation
in air pressure reduced to sea level at Green Bay, Wisconsin.
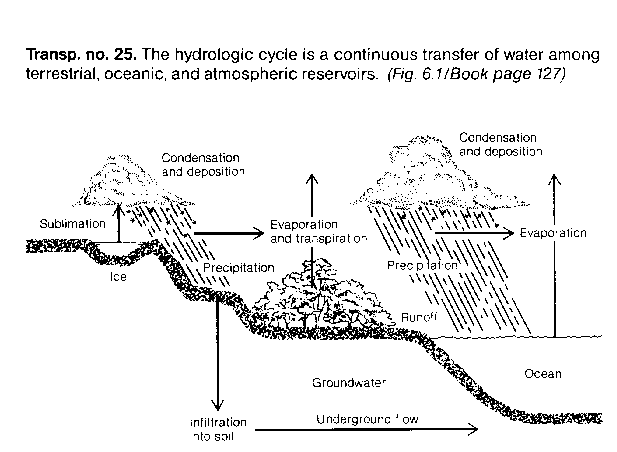
- The hydrologic cycle is a continuous transfer
of water among terrestrial, oceanic, and atmospheric reservoirs.
- On a calm day relative humidity varies inversely
with air temperature.
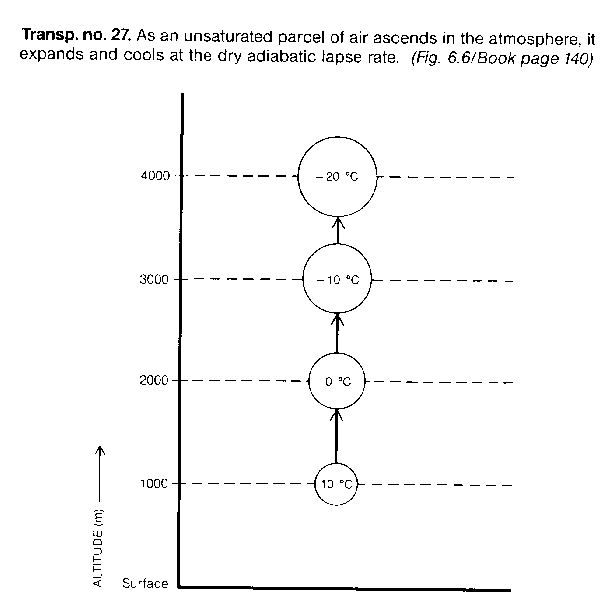
- As an unsaturated parcel of air ascends in the
atmosphere, it expands and cools at the dry adiabatic lapse rate.
- Rising parcels of saturated (cloudy) air cool
at the moist adiabatic lapse rate.
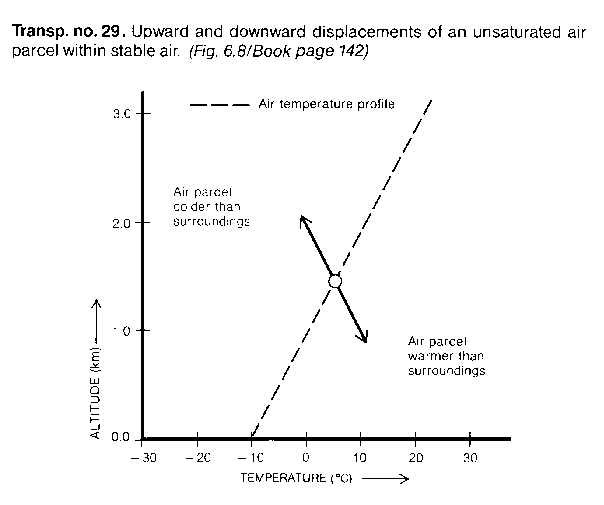
- Upward and downward displacements of an unsaturated
air parcel within stable air.
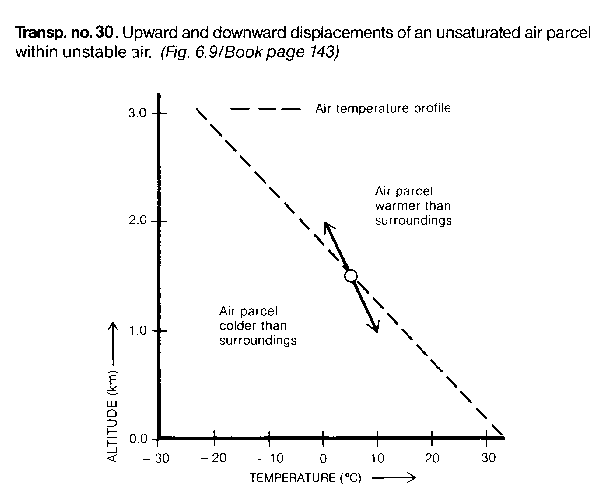
- Upward and downward displacements of an unsaturated
air parcel within unstable air.
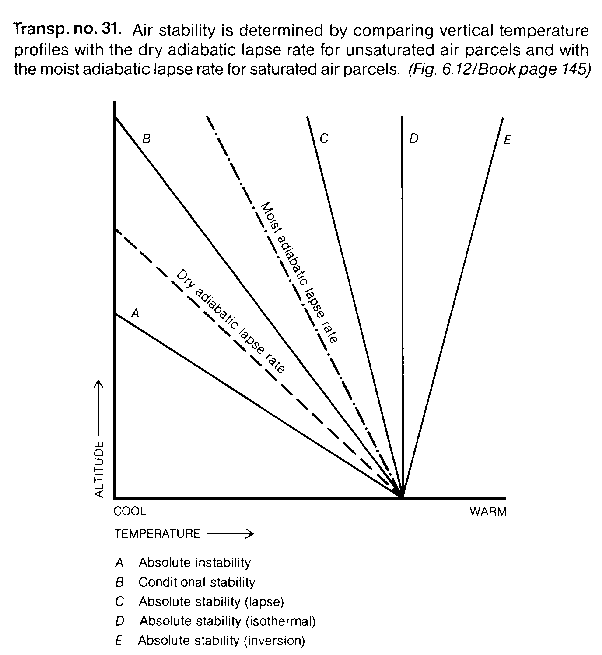
- Air stability is determined by comparing vertical
temperature profiles with the dry adiabatic lapse rate for unsaturated
air parcels and with the moist adiabatic lapse rate for saturated air parcels.
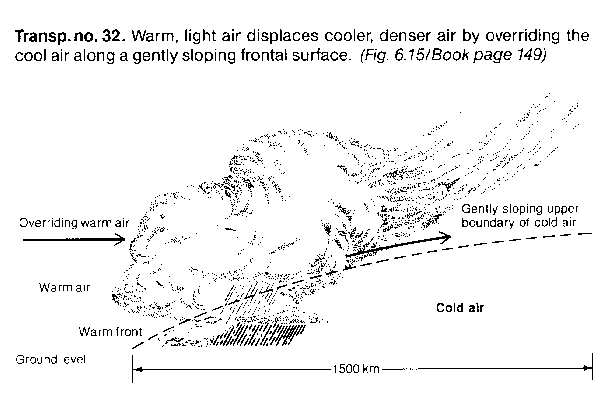
- Warm, light air displaces cooler, denser air
by overriding the cool air along a gently sloping frontal surface.
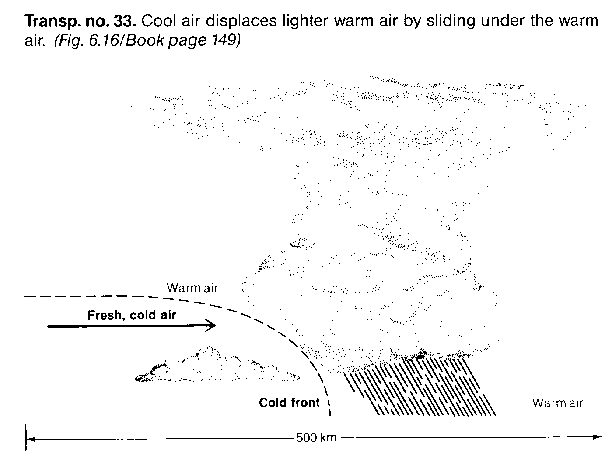
- Cool air displaces lighter warm air by sliding
under the warm air.
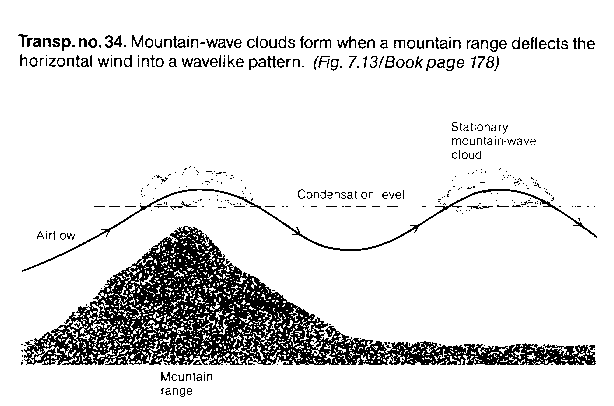
- Mountain-wave clouds form when a mountain range
deflects the horizontal wind into a wavelike pattern.
- A relatively large water droplet collides and
coalesces with much smaller droplets in its path.
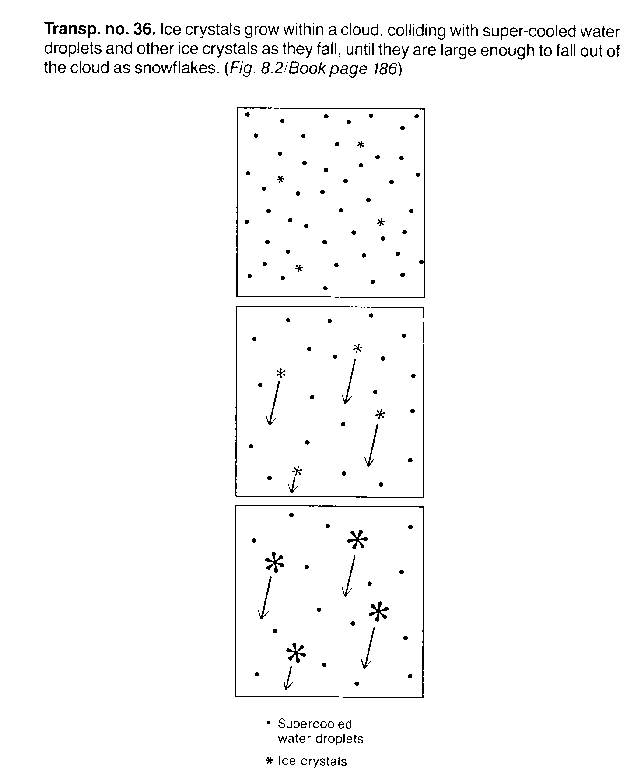
- Ice crystals grow within a cloud, colliding with
super-cooled water droplets and other ice crystals as they fall, until
they are large enough to fall out of the cloud as snowflakes.
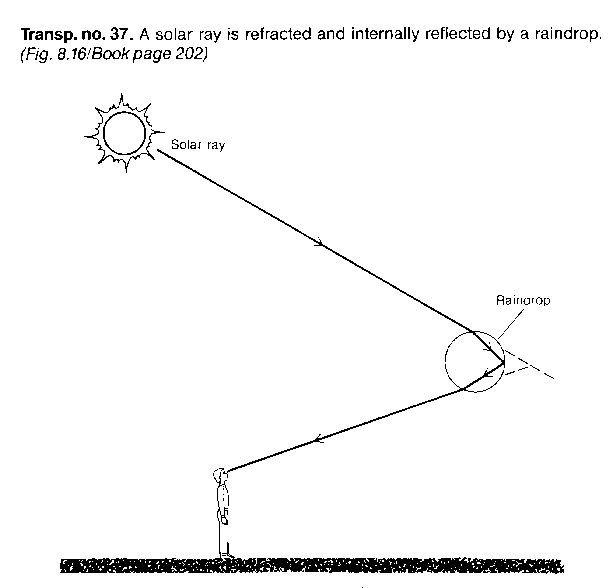
- A solar ray is retracted and internally reflected
by a raindrop.
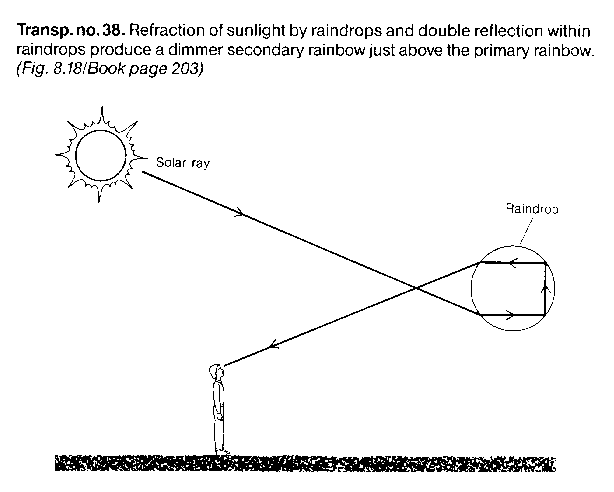
- Refraction of sunlight by raindrops and double
reflection within raindrops produce a dimmer secondary rainbow just above
the primary rainbow.
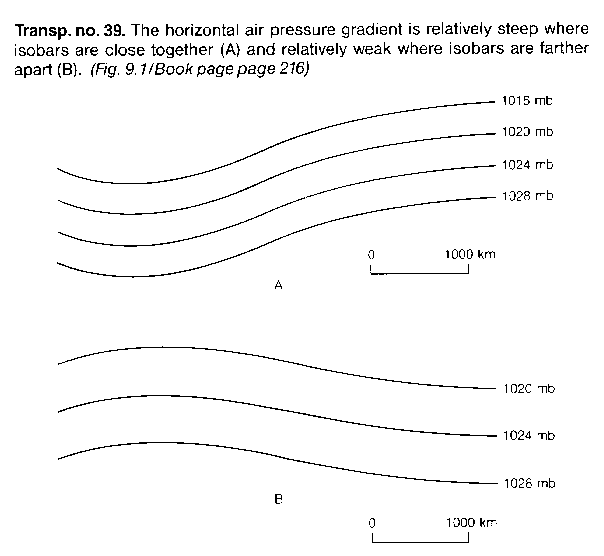
- The horizontal air pressure gradient is relatively
steep where isobars are close together (A) and relatively weak where isobars
are farther apart (B).
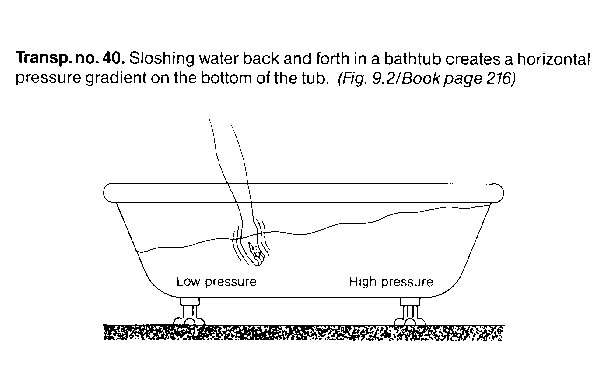
- Sloshing water back and forth in a bathtub creates
a horizontal pressure gradient on the bottom of the tub.
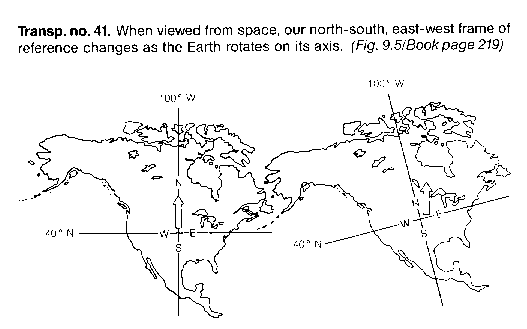
- When viewed from space, our north-south, east-west
frame of reference changes as the Earth rotates on its axis.
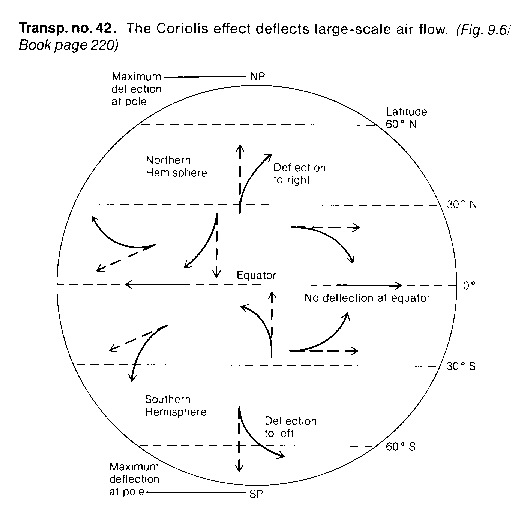
- The Coriolis effect deflects large-scale air
f low.
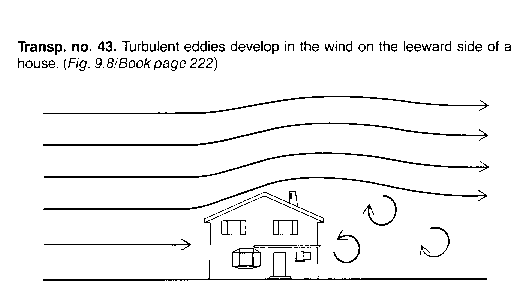
- Turbulent eddies develop in the wind on the leeward
side of a house.
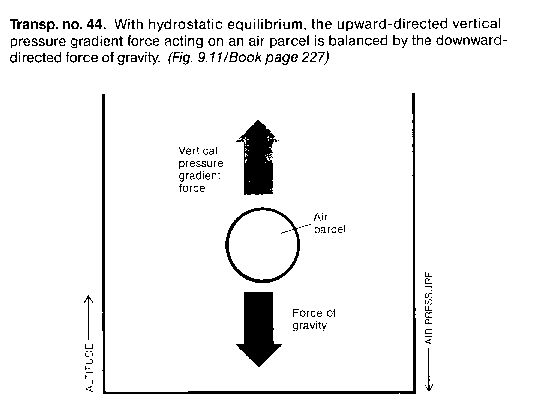
- With hydrostatic equilibrium, the upward-directed
vertical pressure gradient force ating on an air parcel is balanced by
the downward-directed force of gravity.
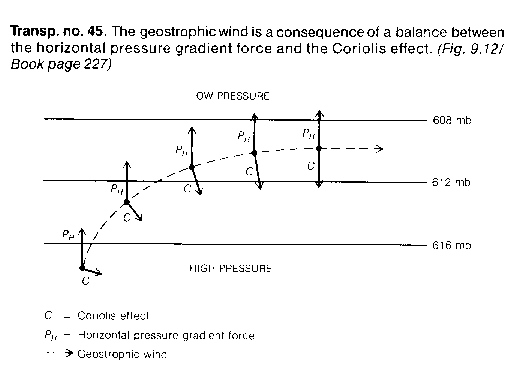
- The geostrophic wind is a consequence of a balance
between the horizontal pressure gradient force and the Coriolis effect.
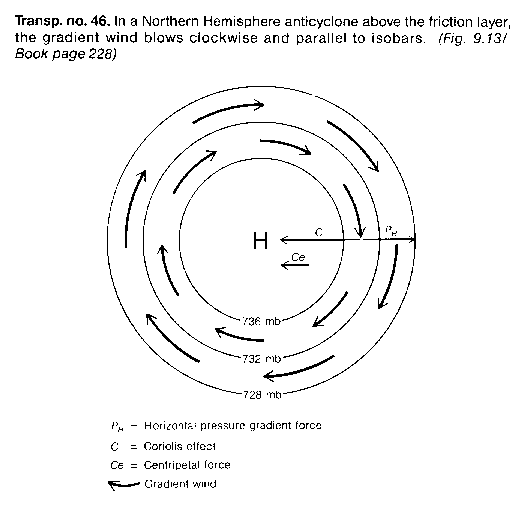
- In a Northern Hemisphere anticyclone above the
friction layer, the gradient wind blows clockwise and parallel to isobars.
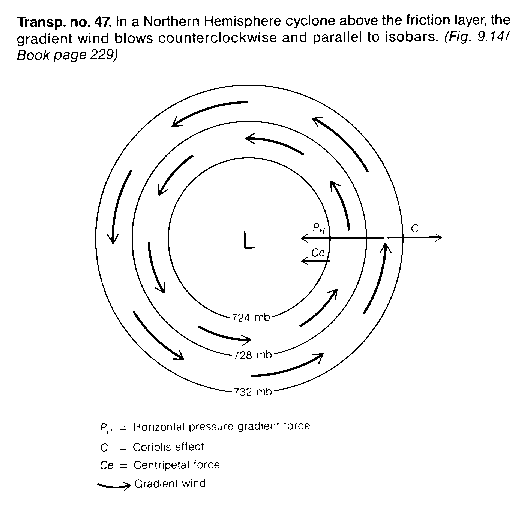
- In a Northern Hemisphere cyclone above the friction
layer, the gradient wind.
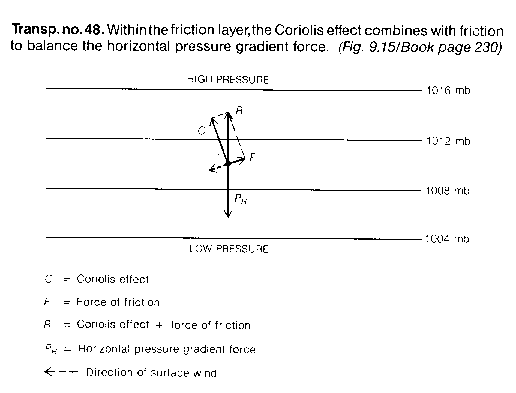
- Within the friction layer, the Coriolis effect
combines with friction to balance the horizontal pressure gradient force.
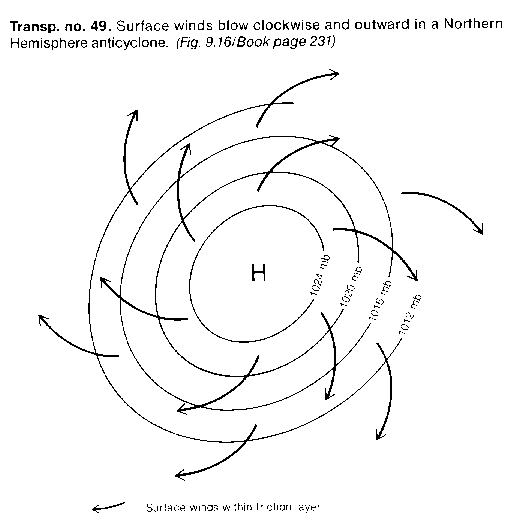
- Surface winds blow clockwise and outward in a
Northern Hemisphere anticyclone.
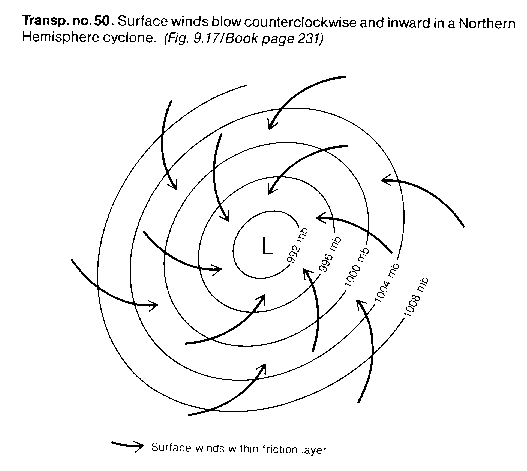
- Surface winds blow counterclockwise and inward
in a Northern Hemisphere cyclone.
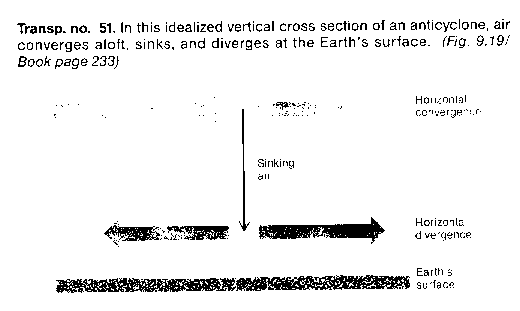
- In this idealized vertical cross section of an anticyclone, air converges
aloft, sinks, and diverges at the Earth's surface.
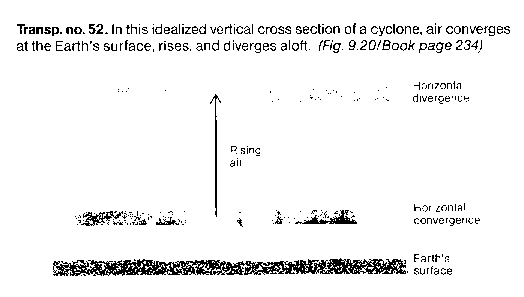
- In this idealized vertical cross section of a cyclone, air converges
at the Earth's surface, rises, and diverges aloft.
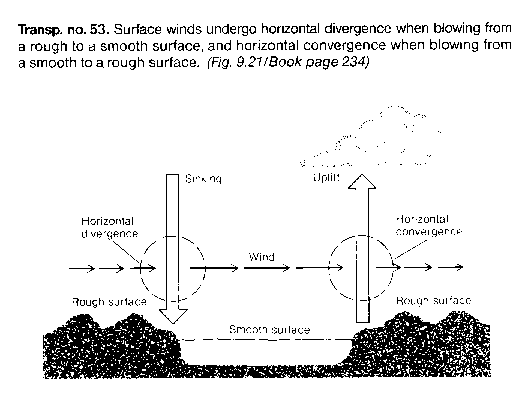
- Surface winds undergo horizontal divergence when blowing from a rough
to a smooth surface, and horizontal convergence when blowing from a smooth
to a rough surface.
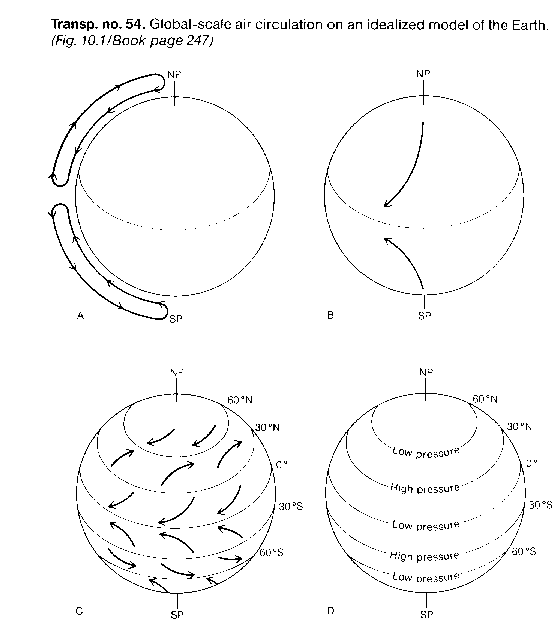
- Global-scale air circulation on an idealized model of the Earth.
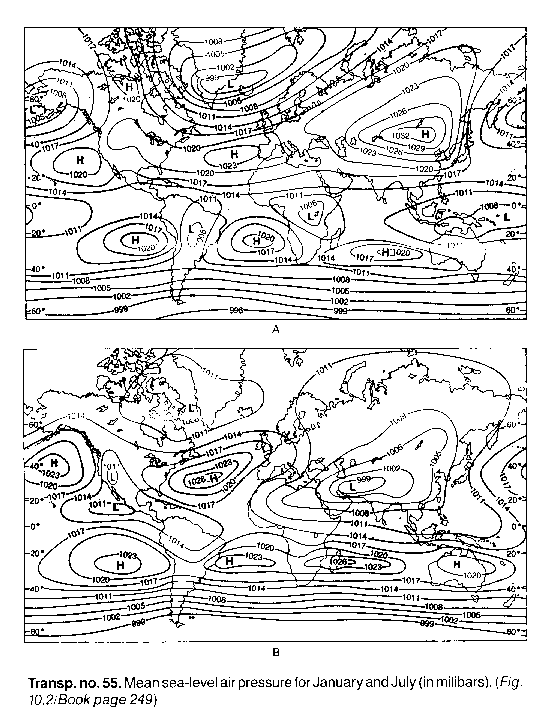
- Man sea-level air pressure for January and July (in milibars).
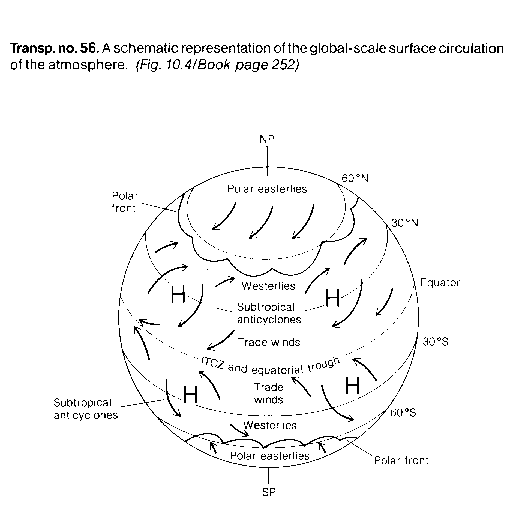
- A schematic representation of the global-scale surface circulation
of the atmosphere.
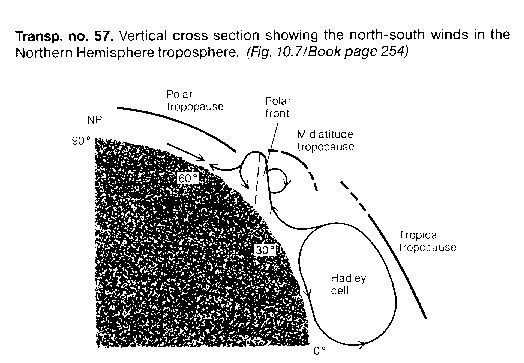
- Vertical cross section showing the north-south winds in the Northern
Hemisphere troposphere.
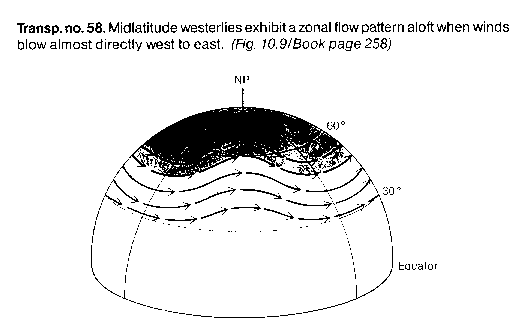
- Midlatitude westerlies exhibit a zonal flow pattern aloft when winds
blow almost directly west to east.
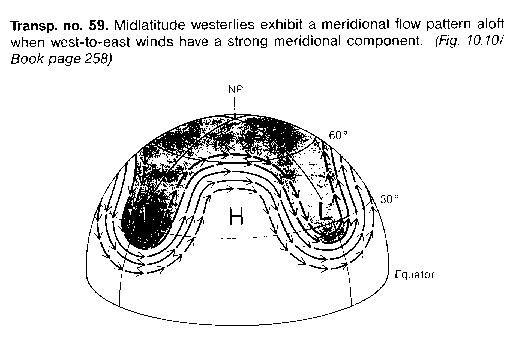
- Midlatitude westerlies exhibit a meridional f low pattern aloft when
west-to-east winds have a strong meridional component.
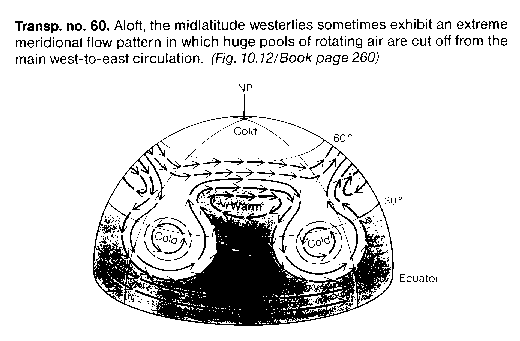
- Aloft, the midiatitude westerlies sometimes exhibit an extreme meridional
f low pattern in which huge pools of rotating air are cut off from the
main west-to-east circulation.
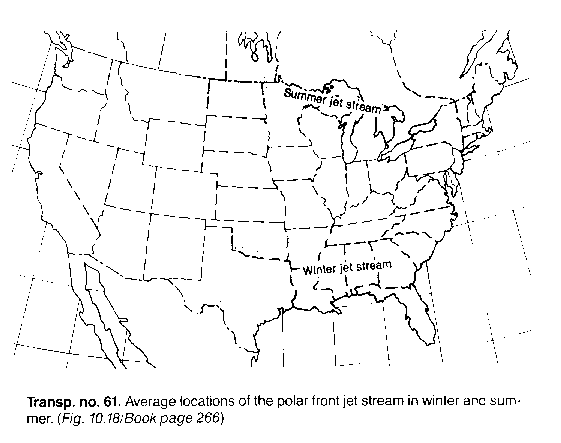
- Average locations of the polar front jet stream in winter and summer.
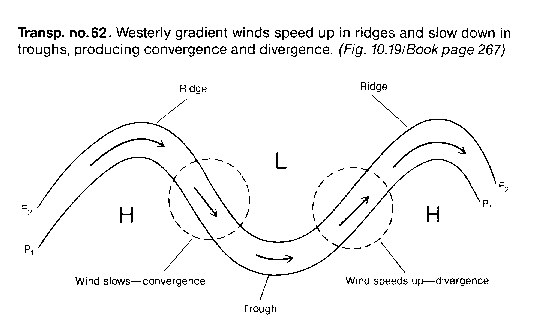
- Westerly gradient winds speed up in ridges and slow down in troughs,
producing convergence and divergence.
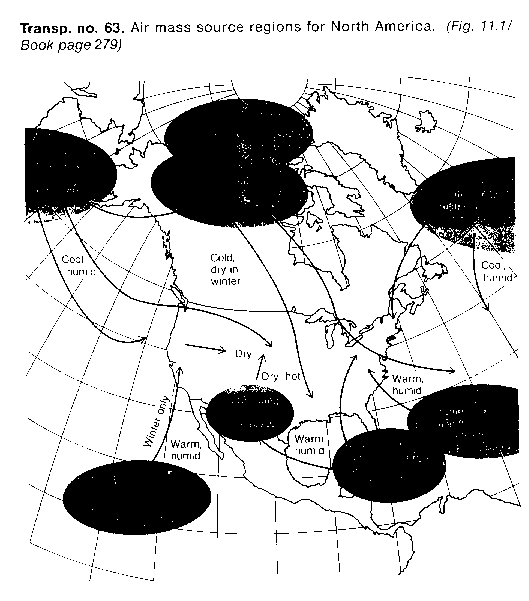
- Air mass source regions for North America.
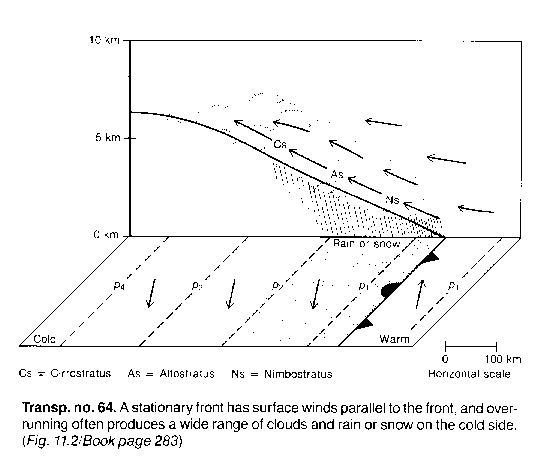
- A stationary front has surface winds parallel to the front, and overrunning
often produces a wide range of clouds and rain or snow on the cold side.
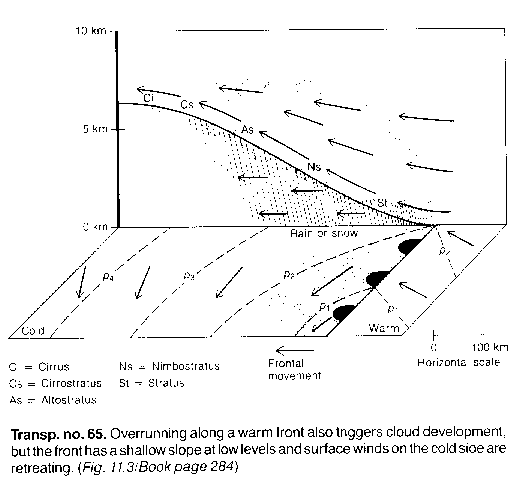
- Overrunning along a warm front also triggers cloud development, but
the front has a shallow slope at low levels and surface winds on the cold
side are retreating.
- Surface winds on the cold side of a cold front blow toward the front,
and clouds and precipitation occur only in a narrow band at and just ahead
of it.
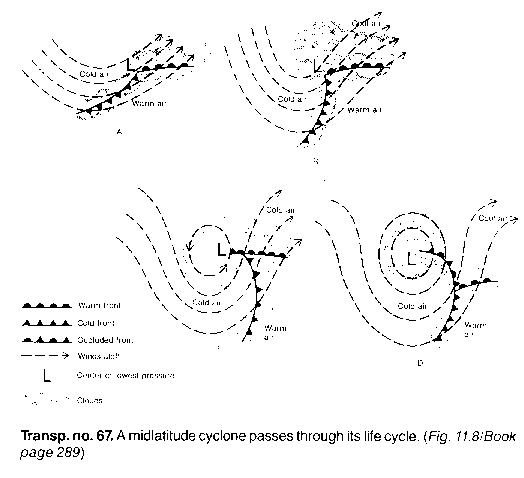
- A midlatitude cyclone passes through its life cycle.
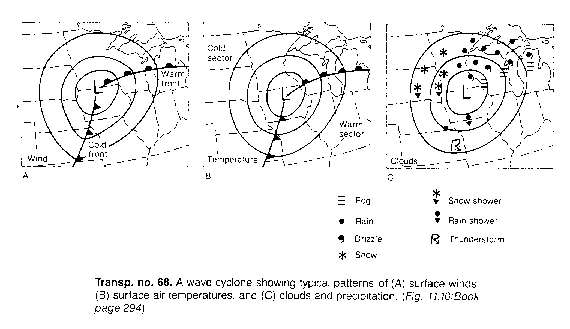
- A wave cyclone showing typical patterns of (A) surface winds, (B) surface
air temperatures, and (C) clouds and precipitation.
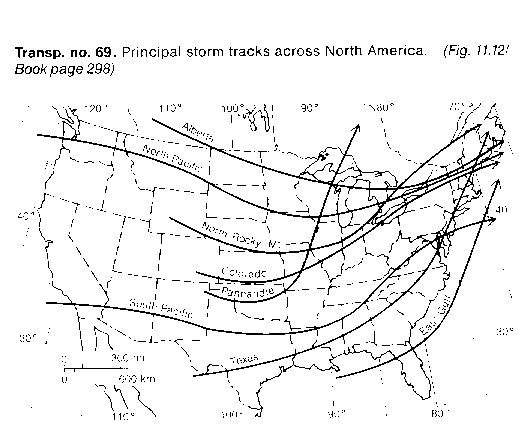
- Principal storm tracks across North America.
- Surface air streams during the monsoon circulations of January and
July.
- Vertical cross sections of (A) a sea (or lake) breeze and (B) a land
breeze.
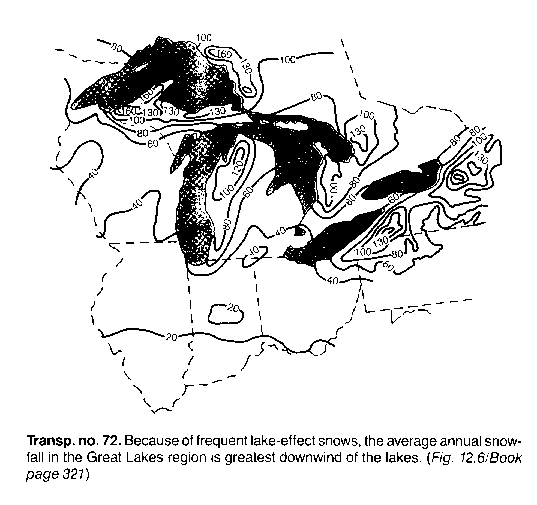
- Because of frequent lake-effect snows, the average annual snowfall
in the Great Lakes region is greatest downwind of the lakes.
- When circulation about an anticyclone or cyclone far leeward of a mountain
range pulls air down the leeward slope, warm, dry chinook winds develop.
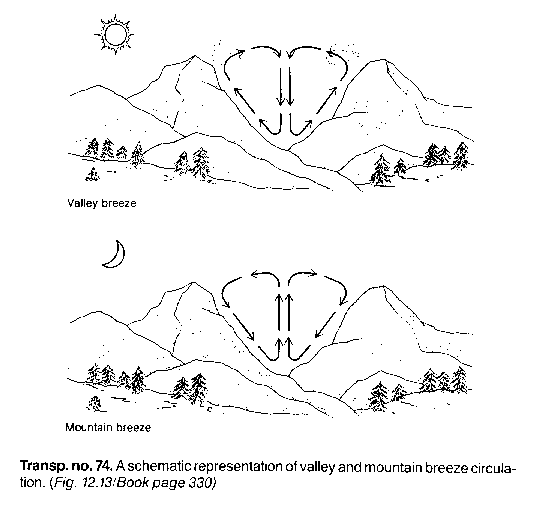
- A schematic representation of valley and mountain breeze circulation.
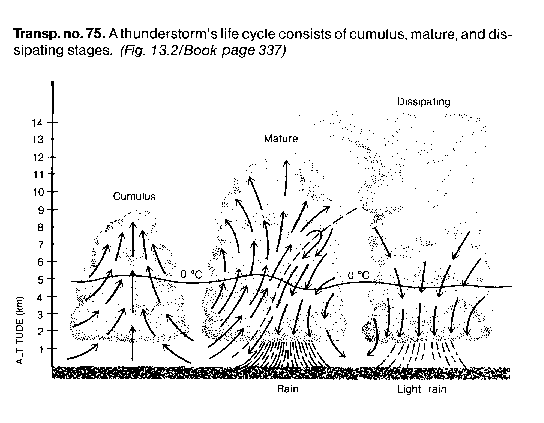
- A thunderstorm's life cycle consists of cumulus, mature, and dissipating
stages.
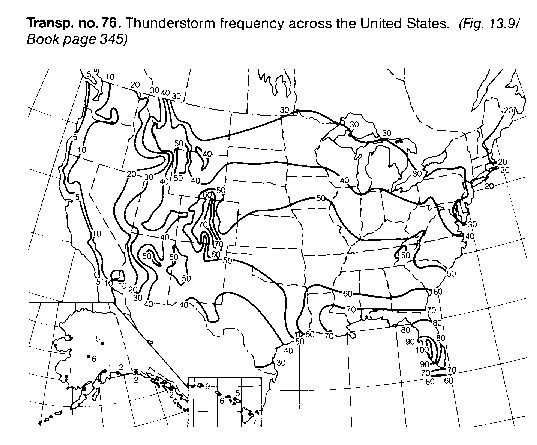
- Thunderstorm frequency across the United States.
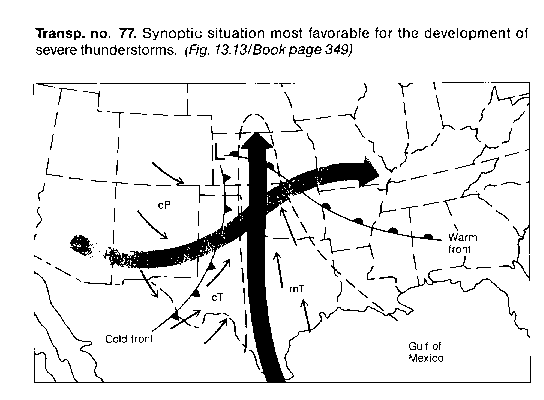
- Synoptic situation most favorable for the development of severe thunderstorms.
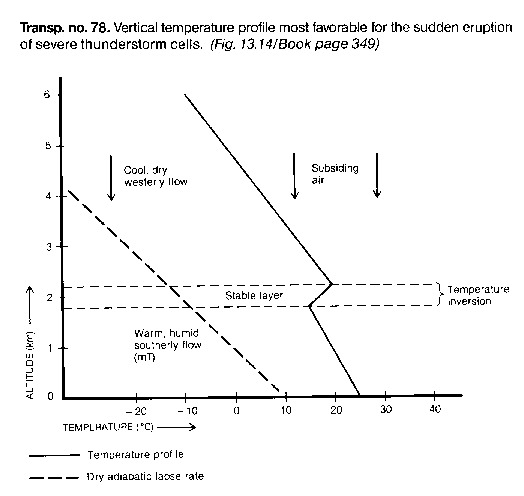
- Vertical temperature profile most f avorable for the sudden eruption
of severe thunderstorms.
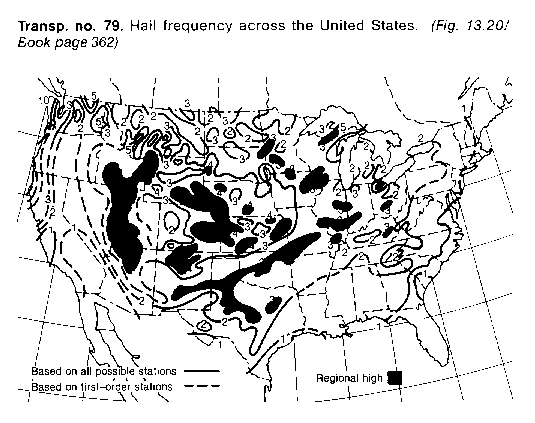
- Hail frequency across the United States.
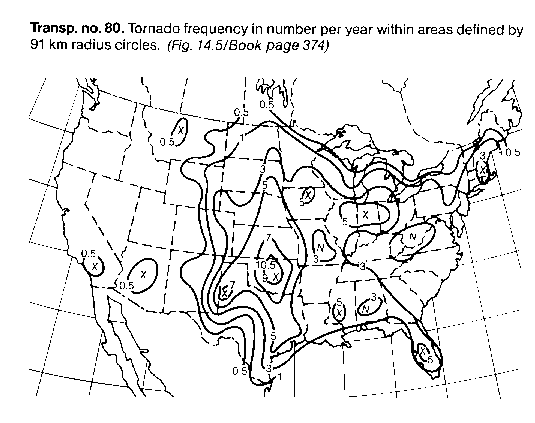
- Tornado frequency in number per year within areas defined by 91 km
radius circles.
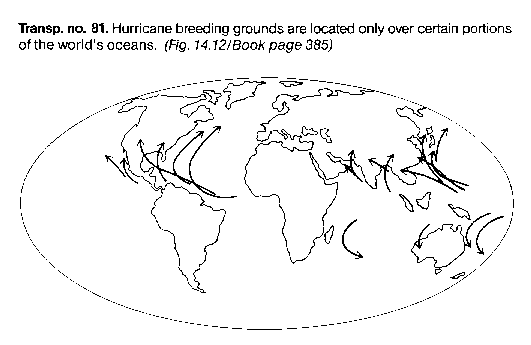
- Hurricane breeding grounds are located only over certain portions
of the world's oceans.
- Hurrricane trajectories are often erratic.
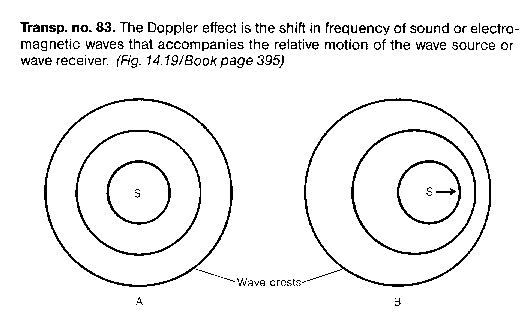
- The Doppler effect is the shift in frequency of sound or electromagnetic
waves that accompanies the relative motion of the wave source or wave receiver.
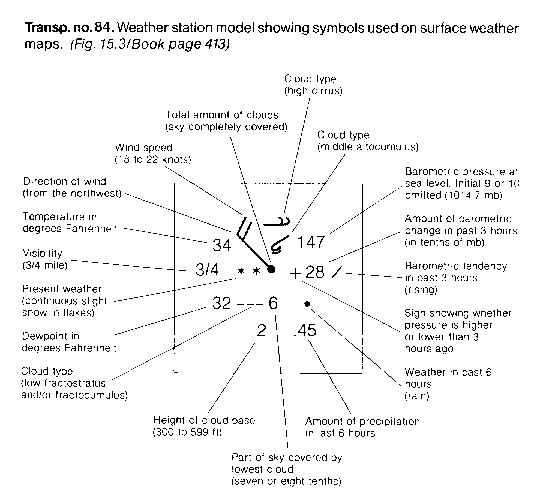
- Weather station model showing symbols used on surface weather maps.
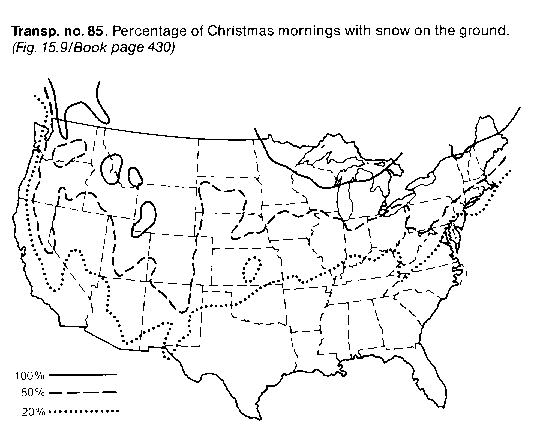
- Percentage of Christmas mornings with snow on the ground.
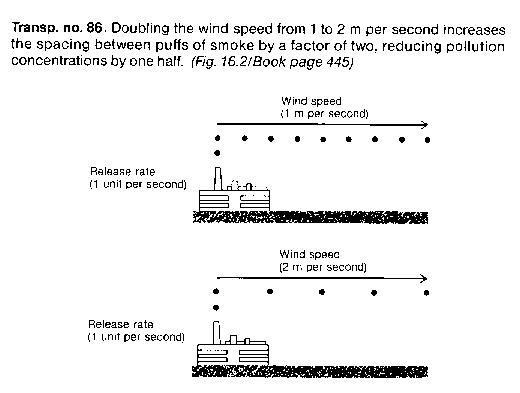
- Doubling the wind speed from 1 to 2 m per second increases the spacing
between puffs of smoke by a factor of two, reducing pollution concentrations
by one half.
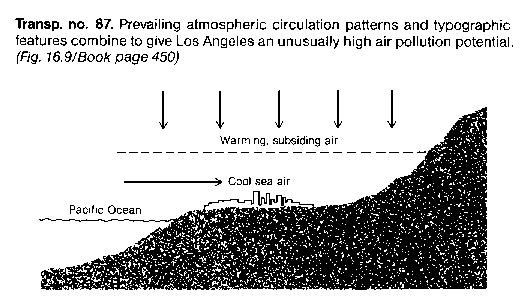
- Prevailing atmospheric circulation patterns and typographic features
combine to give Los Angeles an unusually high air pollution potential.
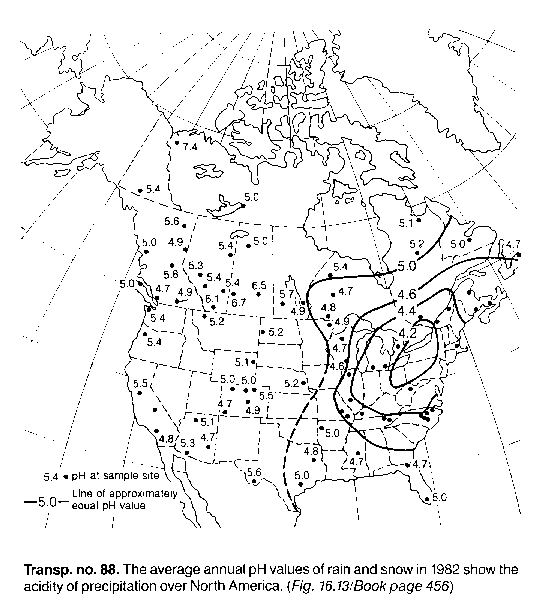
- The average annual pH values of rain and snow in 1982 show the acidity
of precipitation over North America.
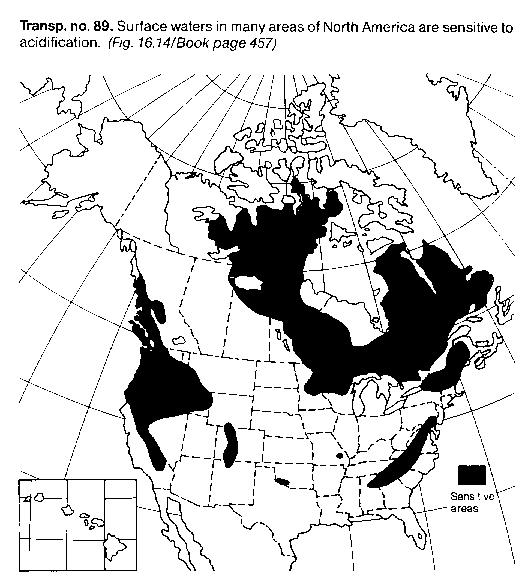
- Surface waters in many areas of North America are sensitive to acidification.
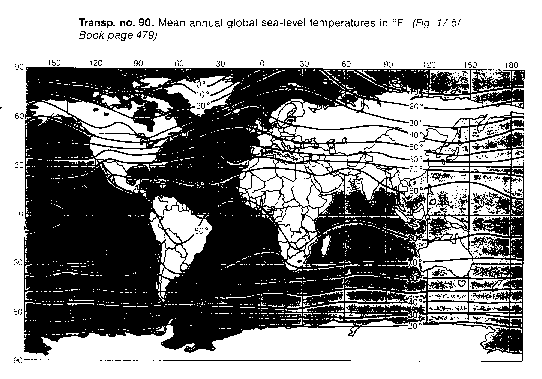
- Mean annual global sea-level temperatures in F.
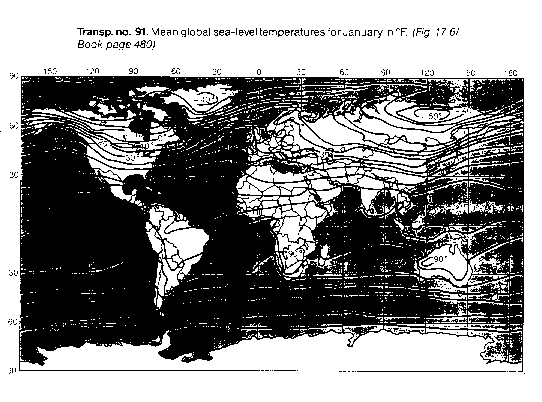
- Mean global sea-level temperatures for January in F.
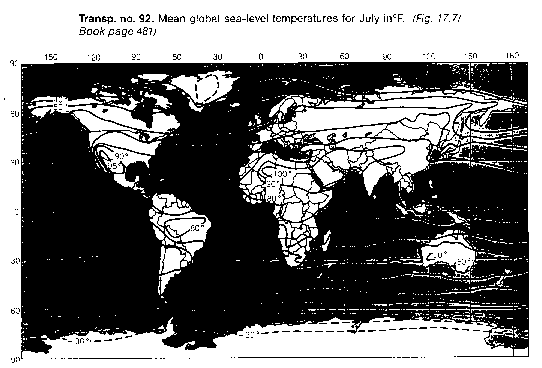
- Mean global sea-level temperatures for July in F.
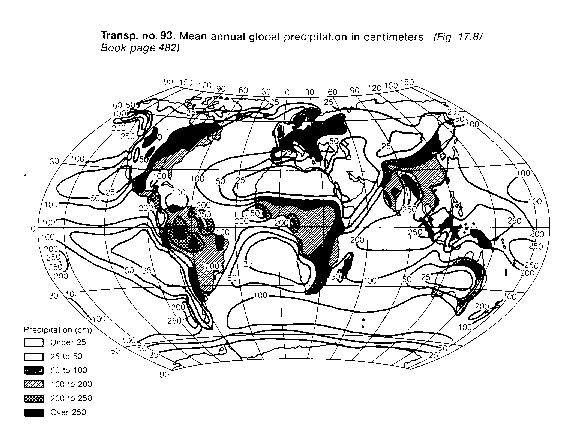
- Mean annual global precipitation in centimeters.
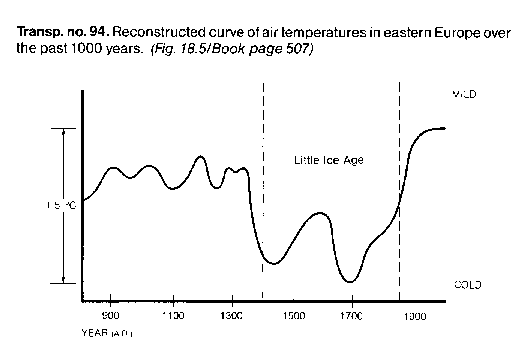
- Reconstruced curve of air temperatures in eastern Europe over the past
1000 years.
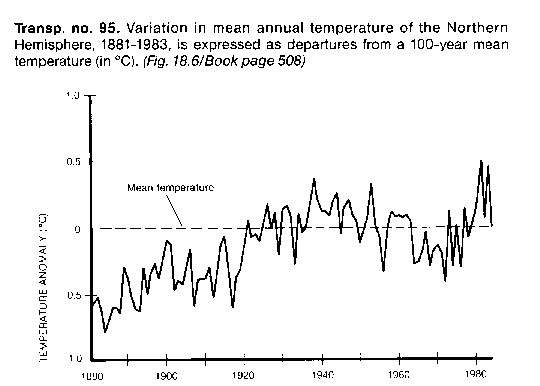
- Variation in mean annual temperature of the Northern Hemisphere, 1881-1983,
is expressed as departures from a 100-year mean temperature (in 'C).
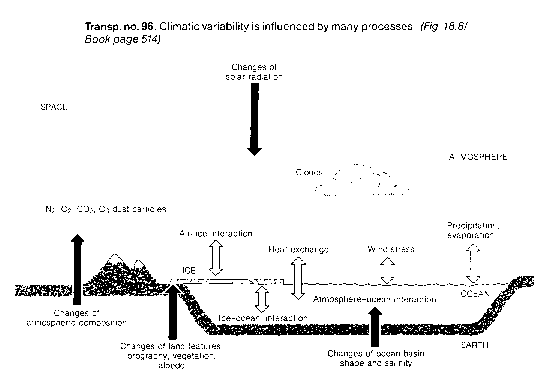
- Climatic variability is influenced by many processes.
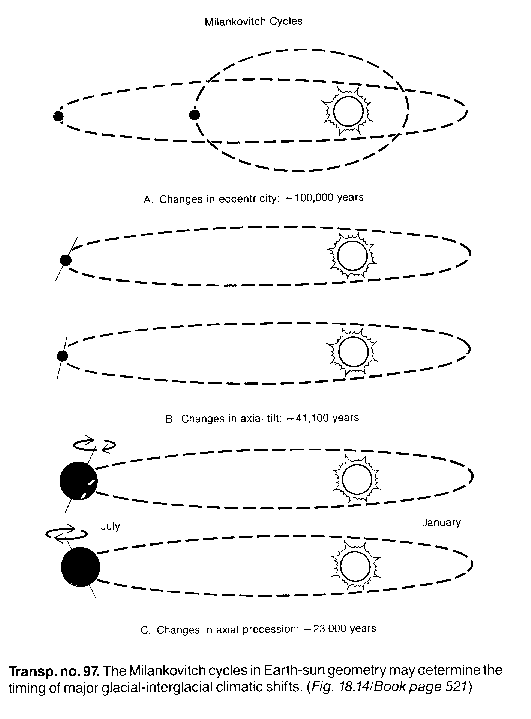
- The Milankovitch cycles in Earth-sun geometry may determine the timing
of major glacial-interglacial climatic shifts.
- Upward trend in atmospheric carbon dioxide levels as measured at Mauna
Loa Observatory, Hawaii.
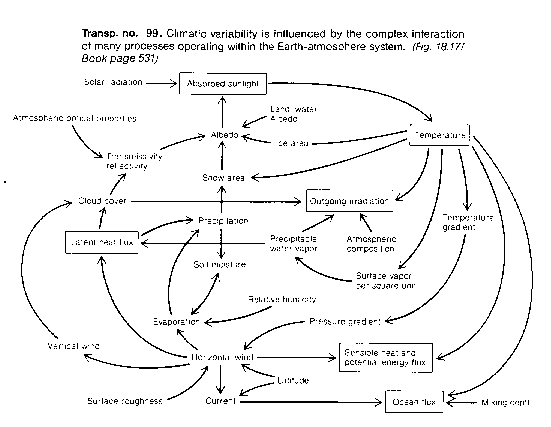
- Climatic variability is influenced by the complex interaction of many
processes operating within the Earth-atmosphere system.
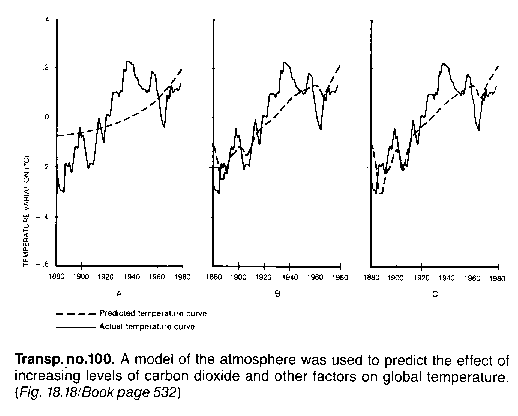
- A model of the atmosphere was used to predict the effect of increasing
levels of carbon dioxide and other factors on global temperature.