![[Header Map]](/images/header.gif)
![]()
| Current & Forecast Images |
| Surface |
| Radar | Upper Air
| Meteograms | Satellite
| Precipitation Other | Guidance | Outlooks | AWC Products |
![]() Yesterday's Temps (7 am EST - 7 am EST) Highs ,Lows Forecast: Highs , Lows
Yesterday's Temps (7 am EST - 7 am EST) Highs ,Lows Forecast: Highs , Lows
![]() Convective
Outlook
Day 1,
Day
2, Day 1-2,
[Discussion]
Convective
Outlook
Day 1,
Day
2, Day 1-2,
[Discussion]
![]() Composite
Satellite(WXP)
Composite
Satellite(WXP)
![]() UK Generated Forecast Maps,
ETA Sfc 4-Panel Map,
NGM Sfc 4-Panel Map
UK Generated Forecast Maps,
ETA Sfc 4-Panel Map,
NGM Sfc 4-Panel Map
![]() Surface Model
Comparison(UKAWC): 12 hr, 24 hr,
36 hr, 48 hr
Surface Model
Comparison(UKAWC): 12 hr, 24 hr,
36 hr, 48 hr
![]() 1 to 7 Days MOS
MRF Output(UKAWC): Day 1,
2,
3,
4,
5,
6,
7,
Movie,
Day 1-4, Day 5-8
1 to 7 Days MOS
MRF Output(UKAWC): Day 1,
2,
3,
4,
5,
6,
7,
Movie,
Day 1-4, Day 5-8
![]() TWC Surface Map
Series: (360Kb)
TWC Surface Map
Series: (360Kb)
 Short Range Precipitation and Frontal
Positions (HPC)
Short Range Precipitation and Frontal
Positions (HPC)
[ 12 Hour ]
[ 18 Hour ]
[ 24 Hour ]
[ 30 Hour ]
[ 36 Hour ]
[ 48 Hour ]
[ Day 3 ]
[ Day 4 ]
[ Day 5 ]
Forecast Discussions (HPC & NCEP):
[ 0-48 ]
[ 3-5 Day ]
[ 6-10 Day ]
[ 30 Day ]
| Radar (Via
TWC,WSI,NCEP) |
| Surface | Upper
Air | Meteograms | Satellite | Precipitation Other | Guidance | Outlooks | AWC Products |
![]() Louisville
|| Hopkinsville,
2nd || Lexington
|| Cincinnati,
2nd
|| Indianapolis
|| SE
Region
Louisville
|| Hopkinsville,
2nd || Lexington
|| Cincinnati,
2nd
|| Indianapolis
|| SE
Region
![]() National
(WSI) || National
Summary (WSI) || National
(USACE) || National
(WXP)
National
(WSI) || National
Summary (WSI) || National
(USACE) || National
(WXP)
![]() National
(NWS/IWIN) || All Nexrads
||
National (TWC) ||
Nation
Radar loop (TWC)
National
(NWS/IWIN) || All Nexrads
||
National (TWC) ||
Nation
Radar loop (TWC)
![]() NCDC Radar Archive
NCDC Radar Archive
| Upper Air Maps |
| Surface | Radar
| Meteograms | Satellite
| Precipitation Other | Guidance | Outlooks | AWC Products |
 |
![]() Upper Air
Forecast Series (WSI): Current Jet
Stream,
12 Hr,
24 Hr,
36 Hr,
48 Hr,
Anim.,
4-Panel
Upper Air
Forecast Series (WSI): Current Jet
Stream,
12 Hr,
24 Hr,
36 Hr,
48 Hr,
Anim.,
4-Panel
![]() UKAWC 4 Panel ETA: 500 mb, 700 mb, 850 mb
UKAWC 4 Panel ETA: 500 mb, 700 mb, 850 mb
![]() 500mb Anomaly 7
day , 30
day , 90
day
500mb Anomaly 7
day , 30
day , 90
day
| Meteograms |
| Surface | Radar
| Upper Air | Satellite | Precipitation Other | Guidance | Outlooks | AWC Products |
|
Additional Meteograms
|
|
Past Meteogram
|
60 Hour Forecast Meteogram
|
8 Day Forecast Meteogram
|
| Soundings
|
| Satellite (Via WSI) |
| Surface | Radar
| Upper Air | Meteograms
| Precipitation Other | Guidance | Outlooks | AWC Products |
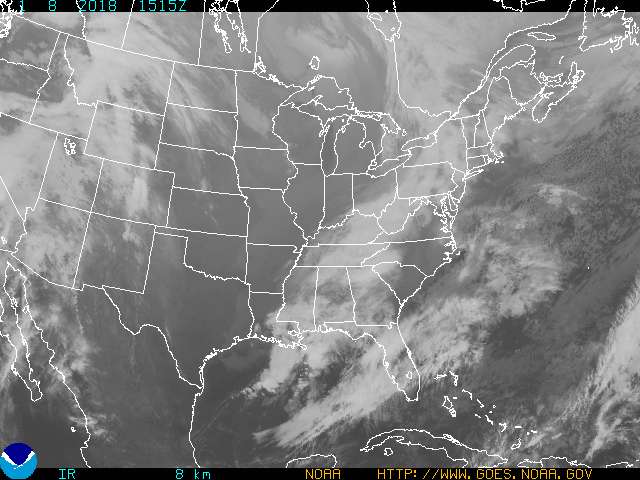
![]() High Res. US,
National
Loop (TWC), GOES-8
IR , GOES8-VIS
, Water
Vapor , Enhanced
IR , Global ,
All
High Res. US,
National
Loop (TWC), GOES-8
IR , GOES8-VIS
, Water
Vapor , Enhanced
IR , Global ,
All
| Precipitation
Estimates/Forecasts |
| Surface | Radar
| Upper Air | Meteograms
| Satellite Other | Guidance | Outlooks | AWC Products |
![]() 24-hr (7am-7am EST) US
Rainfall Total Map, 7 Day Animation
24-hr (7am-7am EST) US
Rainfall Total Map, 7 Day Animation
![]() 24-hr (7am-7am EST) US
Rainfall Total Map (Supp. OBS),
7 Day Animation
24-hr (7am-7am EST) US
Rainfall Total Map (Supp. OBS),
7 Day Animation
![]() IFLOWS Regional Rainfall: 1 hr, 3 hr, 6 hr, 12 hr, 24 hr, 6 hr animation (About IFLOWS)
IFLOWS Regional Rainfall: 1 hr, 3 hr, 6 hr, 12 hr, 24 hr, 6 hr animation (About IFLOWS)
![]() IFLOWS Kentucky Rainfall: 1 hr, 3 hr, 6 hr, 12 hr, 24 hr, 6 hr animation
IFLOWS Kentucky Rainfall: 1 hr, 3 hr, 6 hr, 12 hr, 24 hr, 6 hr animation
![]() 30 day National Rain Total,
90 day National Rain Total
30 day National Rain Total,
90 day National Rain Total ![]()
![]() Quantitative
Precip Forecast (QPF) Discussion, Day 1 ,
Day 2 ,
5
Day Precip Forecast
Quantitative
Precip Forecast (QPF) Discussion, Day 1 ,
Day 2 ,
5
Day Precip Forecast
![]() Precipitation
Estimates (via WSI)
Precipitation
Estimates (via WSI)
![]() National
Precipitation Forecast (TWC)
National
Precipitation Forecast (TWC)
![]() Drought
Severity Index (via NOAA)
Drought
Severity Index (via NOAA)
![]() Relative Humidity Forecast - ETA
Relative Humidity Forecast - ETA
| Other Maps |
| Surface | Radar
| Upper Air | Meteograms
| Satellite Precipitation | Guidance | Outlooks | AWC Products |
![]() U.S. Soil Moisture
Map/Forecast (via GrADS)
U.S. Soil Moisture
Map/Forecast (via GrADS)
![]() U.S. Temperature,
Precip & Soil Moisture Forecasts (via GrADS)
U.S. Temperature,
Precip & Soil Moisture Forecasts (via GrADS)
![]() Crop
Moisture Index (JAWF)
Crop
Moisture Index (JAWF)
![]() Total
Growing Degree Days (JAWF)
Total
Growing Degree Days (JAWF)
![]() Weekly
Soil Temperatures (� 4-inch Bare) (JAWF)
Weekly
Soil Temperatures (� 4-inch Bare) (JAWF)
![]() For Student Weather Briefs (Auto-Refresh):The BIG Weather Picture (Multiple sources: 150k)
For Student Weather Briefs (Auto-Refresh):The BIG Weather Picture (Multiple sources: 150k)
| Hourly Ag Weather
Guidance |
| Surface | Radar
| Upper Air | Meteograms
| Satellite Precipitation | Other | Outlooks | AWC Products |
![]() Model Forecast Data - Nested Grid Model (NGM)
Model Forecast Data - Nested Grid Model (NGM)
![]() More Hourly
Guidance(NWS)
More Hourly
Guidance(NWS)
![]() More Daily
Guidance: Lexington/Louisville
, Paducah
More Daily
Guidance: Lexington/Louisville
, Paducah
| Long Range Outlooks
(Via NOAA) |
| Surface | Radar
| Upper Air | Meteograms
| Satellite Precipitation | Other | Guidance | AWC Products |
| Additional AWC Products |
| Surface | Radar
| Upper Air | Meteograms
| Satellite Precipitation | Other | Guidance | Outlooks | |
![]()